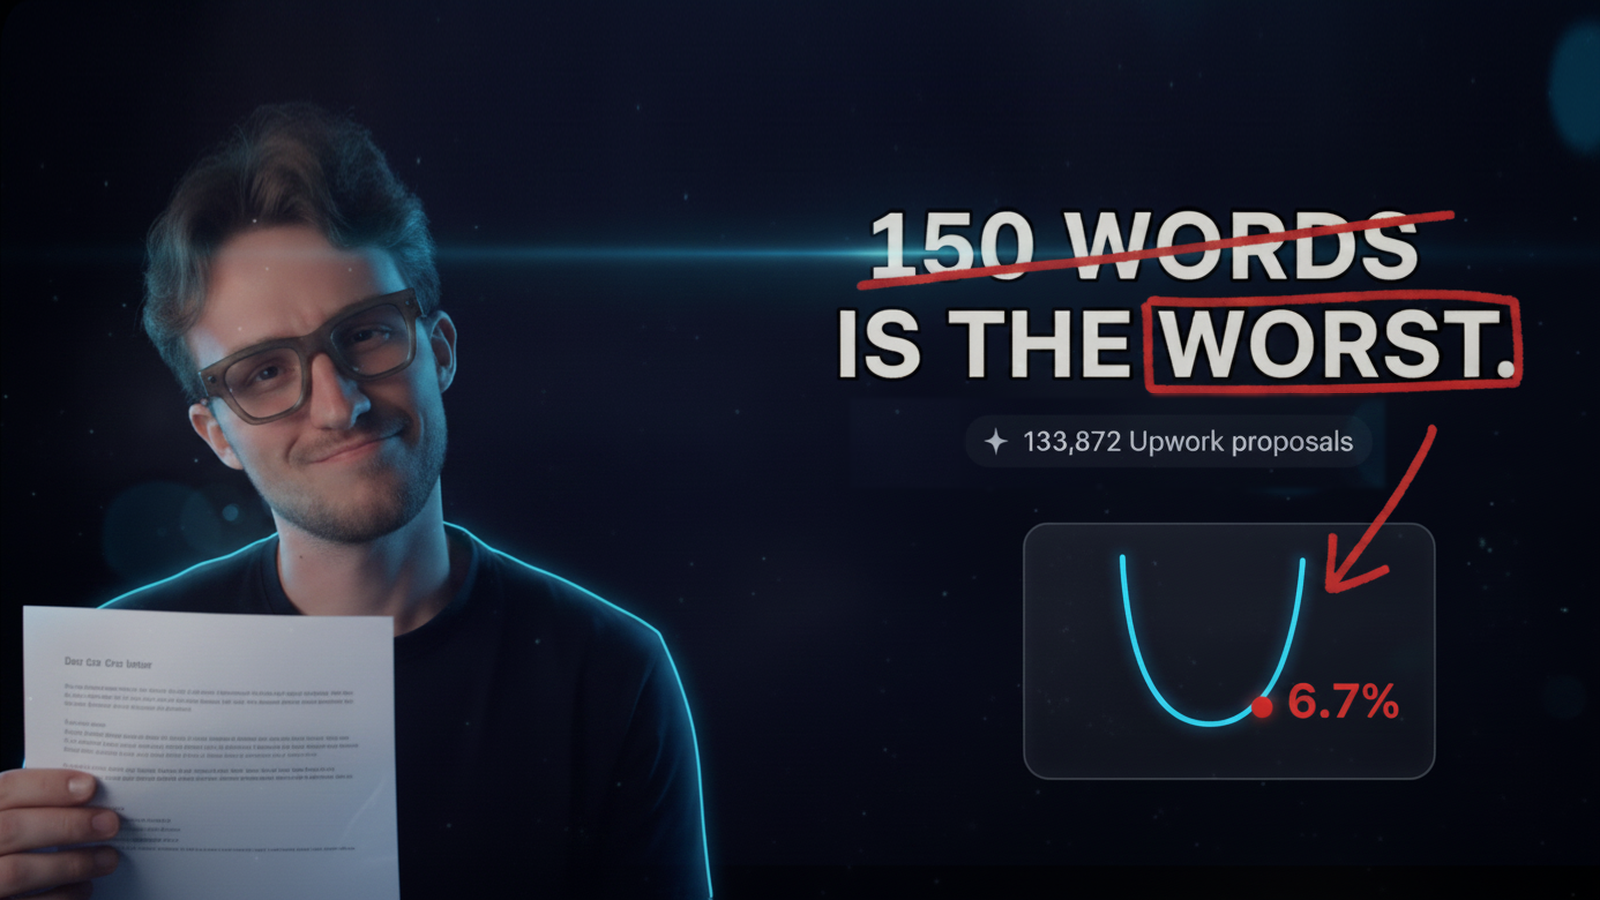
On Upwork, most agencies treat performance like folklore—“design gets more replies,” “dev is harder to close,” “big budgets are slower.” Useful hunches, but hunches don’t staff teams or forecast revenue. You need directional numbers you can plan around: expected reply rates, shortlist percentages, and realistic win ranges for your lane and deal size. This article provides exactly that—a grounded, practical set of upwork proposal benchmarks by category, paired with budget tier benchmarks upwork so you can focus on opportunities with the highest yield.
These aren’t platform-blessed absolutes; they’re working ranges that match what well-run bidding pods see when they respond fast, qualify well, and send outcome-led proposals. Treat every percentage as a band, not a promise. If you run a tight SLA (first response in <30 minutes), use clear acceptance criteria (“Done = …”), and keep your menu simple (Lean / Standard / Priority), you should fall toward the upper half of the ranges.
Definitions and guardrails (so we compare apples to apples)
- Reply rate: % of proposals that receive any buyer response within 7 days.
- Shortlist rate: % of proposals moved into active conversation or interview (Upwork “interviewing/shortlisted”).
- Win rate: % of proposals that result in a funded milestone.
- Budget tiers: Micro ($0–$499), Starter ($500–$1.5k), Core ($1.5k–$5k), Growth ($5k–$15k), Strategic ($15k+).
- Operational baseline: First reply within 30 minutes during business hours; follow-ups at T+24h and T+72h; proposals under 1 page, outcome-led.
If your process is slower or opaque, expect to perform in the lower half of each band.
Global headline ranges (quick compass)
- Reply: 18–45% across categories, with local services and content near the top, enterprise dev near the bottom.
- Shortlist: 12–30% depending on niche clarity and proof artifacts.
- Win: 6–20% overall; higher for tightly scoped, productized offers; lower for custom R&D.
You can improve each metric by 15–30% with two levers: faster first response and clearer outcomes (“Done = …” + one piece of proof).
.webp)
For a deeper dive into how structured sales ops and CRM automation drive those improvements, read our follow-up on pipeline ops for Upwork agencies — it breaks down how top teams use SLAs and automation to scale consistency.
Upwork reply rate by niche (where conversations start)
Below are directional ranges for upwork reply rate by niche assuming strong fit and on-time responses.
- Local Services (web/SEO for SMB): 35–45%
- Content & SEO (B2B/B2C): 32–42%
- Design / UI-UX (product flows, not logos): 26–36%
- eCommerce (Shopify/BigCommerce performance & CRO): 24–34%
- Web Dev (Front-end, Next.js/React builds): 20–30%
- Data & AI (RAG, analytics, ML ops): 18–28%
- Mobile (iOS/Android): 18–26%
- Enterprise / Regulated (Fintech/Health/Gov): 16–24%
Why: Buyers reply when they feel seen. Niche language (“PDP/PLP LCP < 2.8s” for eCom; “activation event fired” for SaaS) lifts replies. Vague full-stack promises depress them.
Shortlist tendencies by category
Shortlisting is where proof beats poetry.
- eCommerce (performance/CRO): 18–28% when you show a before/after Lighthouse or GA4 delta.
- SaaS (activation/onboarding): 16–26% if you anchor to an activation metric and event schema.
- Design / UI-UX: 18–30% with a mid-fi snippet and a testing note (“≥80% task success”).
- Content & SEO: 20–30% when outline-first + internal links + fact check are explicit.
- Web Dev: 14–24% unless you bring a specific scope (landing page in 1 day with analytics).
- Data & AI: 12–22% unless you show eval harness + guardrails (hallucination rate band).
- Local Services: 22–32% when you promise GBP + two service pages + call tracking.
- Enterprise/Regulated: 12–20% rises to 18–26% if you include change control, audit logs, and rollback.
Win rate ranges upwork (what closes)
Let’s put realistic win rate ranges upwork on the table for healthy process discipline.
- Local Services: 12–20% (fast-moving buyers, clear ROI, phone-length approvals).
- Content & SEO: 10–18% (outline-first packages win; open-ended retainers are lower).
- Design / UI-UX: 10–16% (prototype + test plan improves odds).
- eCommerce: 10–18% (fix pack + validation sprints close well).
- Web Dev: 8–14% (productized “first mile” wins; custom builds drag).
- SaaS: 8–14% (activation slices beat dashboard overhauls).
- Data & AI: 6–12% (eval-driven packages close better than discovery-only).
- Enterprise/Regulated: 6–10% (wins happen with risk language + governance).
If you’re materially below these bands, check SLAs (speed), proposals (outcomes vs hours), and proof (one artifact per proposal).
.webp)
Budget tier benchmarks upwork (how deal size shifts the odds)
Budget determines buyer behavior and scrutiny. Here’s how budget tier benchmarks upwork typically behave across most categories:
- Micro ($0–$499):
- Reply 28–42% • Shortlist 18–28% • Win 10–18%
- Fast yeses for tight maintenance, audits, or outline-first content. Beware margin creep.
- Reply 28–42% • Shortlist 18–28% • Win 10–18%
- Starter ($500–$1.5k):
- Reply 24–38% • Shortlist 16–26% • Win 10–16%
- Sweet spot for first-mile sprints (eCom fix packs; SaaS activation; UX mini-prototypes).
- Reply 24–38% • Shortlist 16–26% • Win 10–16%
- Core ($1.5k–$5k):
- Reply 20–32% • Shortlist 14–24% • Win 8–14%
- Requires a bit more proof and slightly longer cycles. Still closes briskly with clear “Done = …”.
- Reply 20–32% • Shortlist 14–24% • Win 8–14%
- Growth ($5k–$15k):
- Reply 16–26% • Shortlist 12–20% • Win 6–12%
- Procurement peeks in; add governance (QA plan, logs, rollback) and dates.
- Reply 16–26% • Shortlist 12–20% • Win 6–12%
- Strategic ($15k+):
- Reply 12–22% • Shortlist 10–18% • Win 6–10%
- You must signal risk control (access policy, audit, acceptance checks). Multi-stakeholder alignment is key.
- Reply 12–22% • Shortlist 10–18% • Win 6–10%
Rule of thumb: as budget rises, reply rate dips a bit, shortlist narrows, and the win rate ranges upwork compress. You offset this with better proof and a staged plan (Lean now, Standard next sprint).
Category deep-dives (what specifically moves the needle)
eCommerce (Shopify/BigCommerce; performance & CRO)
Buyers want speed and conversion, not a redesign lecture. Anchor on CWV thresholds and a simple experiment.
- Use Done = LCP < 2.8s & CLS < 0.1 on PDP/PLP; deliver before/after Lighthouse + GA4 click maps.
- Offer choices: PDP only (Lean), PDP+PLP (Standard), +Home with daily check-ins (Priority).
- Expect reply 24–34%, shortlist 18–28%, win 10–18% when you show one crisp artifact.
SaaS (activation, onboarding, pricing taps)
Product growth buyers respond to measurement and speed to value.
- Promise activation event fired + 1-click import or sample data path; track in Mixpanel/Amplitude.
- Include a 90-second Loom showing the path; add a day-14 uplift check.
- Expect reply 20–30%, shortlist 16–26%, win 8–14% if you avoid “big redesign” talk.
Design / UI-UX (product, not brand)
Executives hire outcomes: clear flows that test well.
- Pitch mid-fi prototype of 3 flows + ≥80% task success in unmoderated tests; add a decision memo.
- Proof = one animated snippet or split-screen before/after with captions.
- Expect reply 26–36%, shortlist 18–30%, win 10–16%.
Content & SEO (B2B/B2C)
Outline-first beats “1,500 words, any topic.”
- Offer outline in 48h + 1,200-word draft in voice with internal links + fact check; for SEO add schema and interlink lifts.
- Proof = two headlines that shipped + a screenshot of organic uplift or engagement.
- Expect reply 32–42%, shortlist 20–30%, win 10–18%.
Web Dev (front-end/productized builds)
Custom everything kills conversion; productize your first mile.
- “Landing page in 1 day with analytics” beats “full-stack build.”
- Done = ship + analytics + rollbacks documented; keep scope to one page or feature.
- Expect reply 20–30%, shortlist 14–24%, win 8–14%.
Data & AI (RAG, analytics, ML ops)
Decisionability matters. Show evals and guardrails.
- Done = accuracy ≥ target on eval set + hallucination rate under X% + policy filters; include a calibration/SHAP plot if modeling.
- Proof = snapshot of eval harness or a tiny before/after for latency p95.
- Expect reply 18–28%, shortlist 12–22%, win 6–12%.
Local Services (SMB sites/SEO/ads)
Plain language, fast results.
- Done = GBP fixed + two service pages with schema + call tracking; deliver a one-pager staff can use.
- Proof = calls/booking lift screenshot; be explicit about geography.
- Expect reply 35–45%, shortlist 22–32%, win 12–20%.
Enterprise/Regulated (Fintech/Health/Gov)
Governance first, then outcomes.
- Include access policy (read-only → elevate), logs, QA, rollback, and a privacy stance (masked data unless approved).
- Keep tone modest; buyers reward risk clarity.
- Expect reply 16–24%, shortlist 12–20%, win 6–10%.
If you want to see how these numbers translate into real growth, check how an eCommerce growth agency turned this exact playbook into $100K in funded work using automated proposal and SLA tracking.
👉 See the case study
What pushes your numbers up (the operating levers)
Even within the same niche and budget tier, teams that run sales ops well outperform. Here’s what consistently lifts the bands:
- First response under 30 minutes: Often a +5–10 pt bump to reply. Use saved searches and alerts; route by niche owner.
- Outcome-led openers: State Done = … in buyer language, not deliverables. Shortlist rates climb when acceptance is testable.
- One proof artifact: Before/after metric, 90-sec Loom, or eval snapshot—never a portfolio dump.
- Menu simplicity: Lean / Standard / Priority with a binary CTA reduces friction and speeds hires.
- Follow-up cadence: T+24h (value add) and T+72h (forwardable summary) nudge without nagging; win rates rise 2–4 pts.
- Category congruence: List and bid where your proof matches the aisle. Mis-categorized proposals underperform.
- Security/compliance notes for larger budgets: Mention change control, logs, and rollback; enterprise shortlist jumps 3–6 pts.
%20(1).webp)
Time-of-day, day-of-week, and boosts (context that matters)
- Respond when they’re online: For US buyers, late EU afternoons/early US mornings lift reply. For AUS, shift earlier.
- Week beginnings: Monday–Tuesday posts get the fastest shortlists; Friday proposals can lag until Monday.
- Boosts: Use sparingly on high-fit, mid-budget posts; boosts won’t fix weak fit or vague scopes. They do amplify already strong replies.
Sample pipeline math (turn ranges into staffing reality)
Imagine you send 100 proposals/month in eCom performance at the Starter/Core tiers, following the operational baseline:
- Reply (28%) → 28 conversations
- Shortlist (22%) → ~22 in interviewing
- Win (12%) → ~12 funded milestones
If your average funded tier is $1,800 (mix of Lean/Standard), you’re forecasting ~$21,600 booked from that lane. Hit the same cadence in one adjacent niche (e.g., SaaS activation) at a slightly lower win (10%), and you add ~$15–$18k. This is how a real upwork agency pipeline turns into predictable capacity planning.
Troubleshooting: if you’re below the band
- Low reply (<15%): Your opener is generic or late. Mirror two specifics, define Done = …, and answer within 30 minutes.
- Low shortlist (<10%): Add a proof artifact and restate acceptance so it’s testable. Make the menu less fussy.
- Low win (<6%): You’re selling hours or big scopes. Productize the first mile, stage the rest, and post the milestone fast after a “yes.”
Run one change at a time for two weeks; re-measure.
The one-page benchmarking checklist (to keep)
- Confirm you’re bidding in the right category for your proof.
- Ensure your opener includes Done = … in buyer language.
- Add one proof artifact (metric, Loom, or eval).
- Keep a Lean/Standard/Priority menu with a binary CTA.
- Hit SLAs: <30m first response, T+24h and T+72h follow-ups.
- Track your own upwork proposal benchmarks by category monthly and compare to these ranges.
- Adjust budget tier benchmarks upwork focus if you’re consistently outside the band.
.webp)
Closing thought
Benchmarks don’t win projects—systems do. Use these ranges to set expectations and to pick your battles: which niches, which tiers, and how many proposals your team truly needs to hit the month. Then let your operating discipline do the compounding work. When your openers speak the buyer’s language, your proof is legible, and your follow-ups add value, the upwork reply rate by niche climbs, shortlists grow, and the win rate ranges upwork start biasing up in your favor. Your pipeline stops feeling like luck—and starts behaving like a machine you can steer.