
Most freelancers treat proposals as a volume game. Top earners treat them like a measured funnel. With the right upwork proposal analytics, you’ll know exactly which niches, hooks, and proof points earn replies—and which waste connects. This article shows you how to set up upwork bid analytics, define the essential upwork metrics, build a lightweight dashboard, and run weekly experiments that move your response rate, win rate, and revenue per proposal.
Define the funnel before you measure
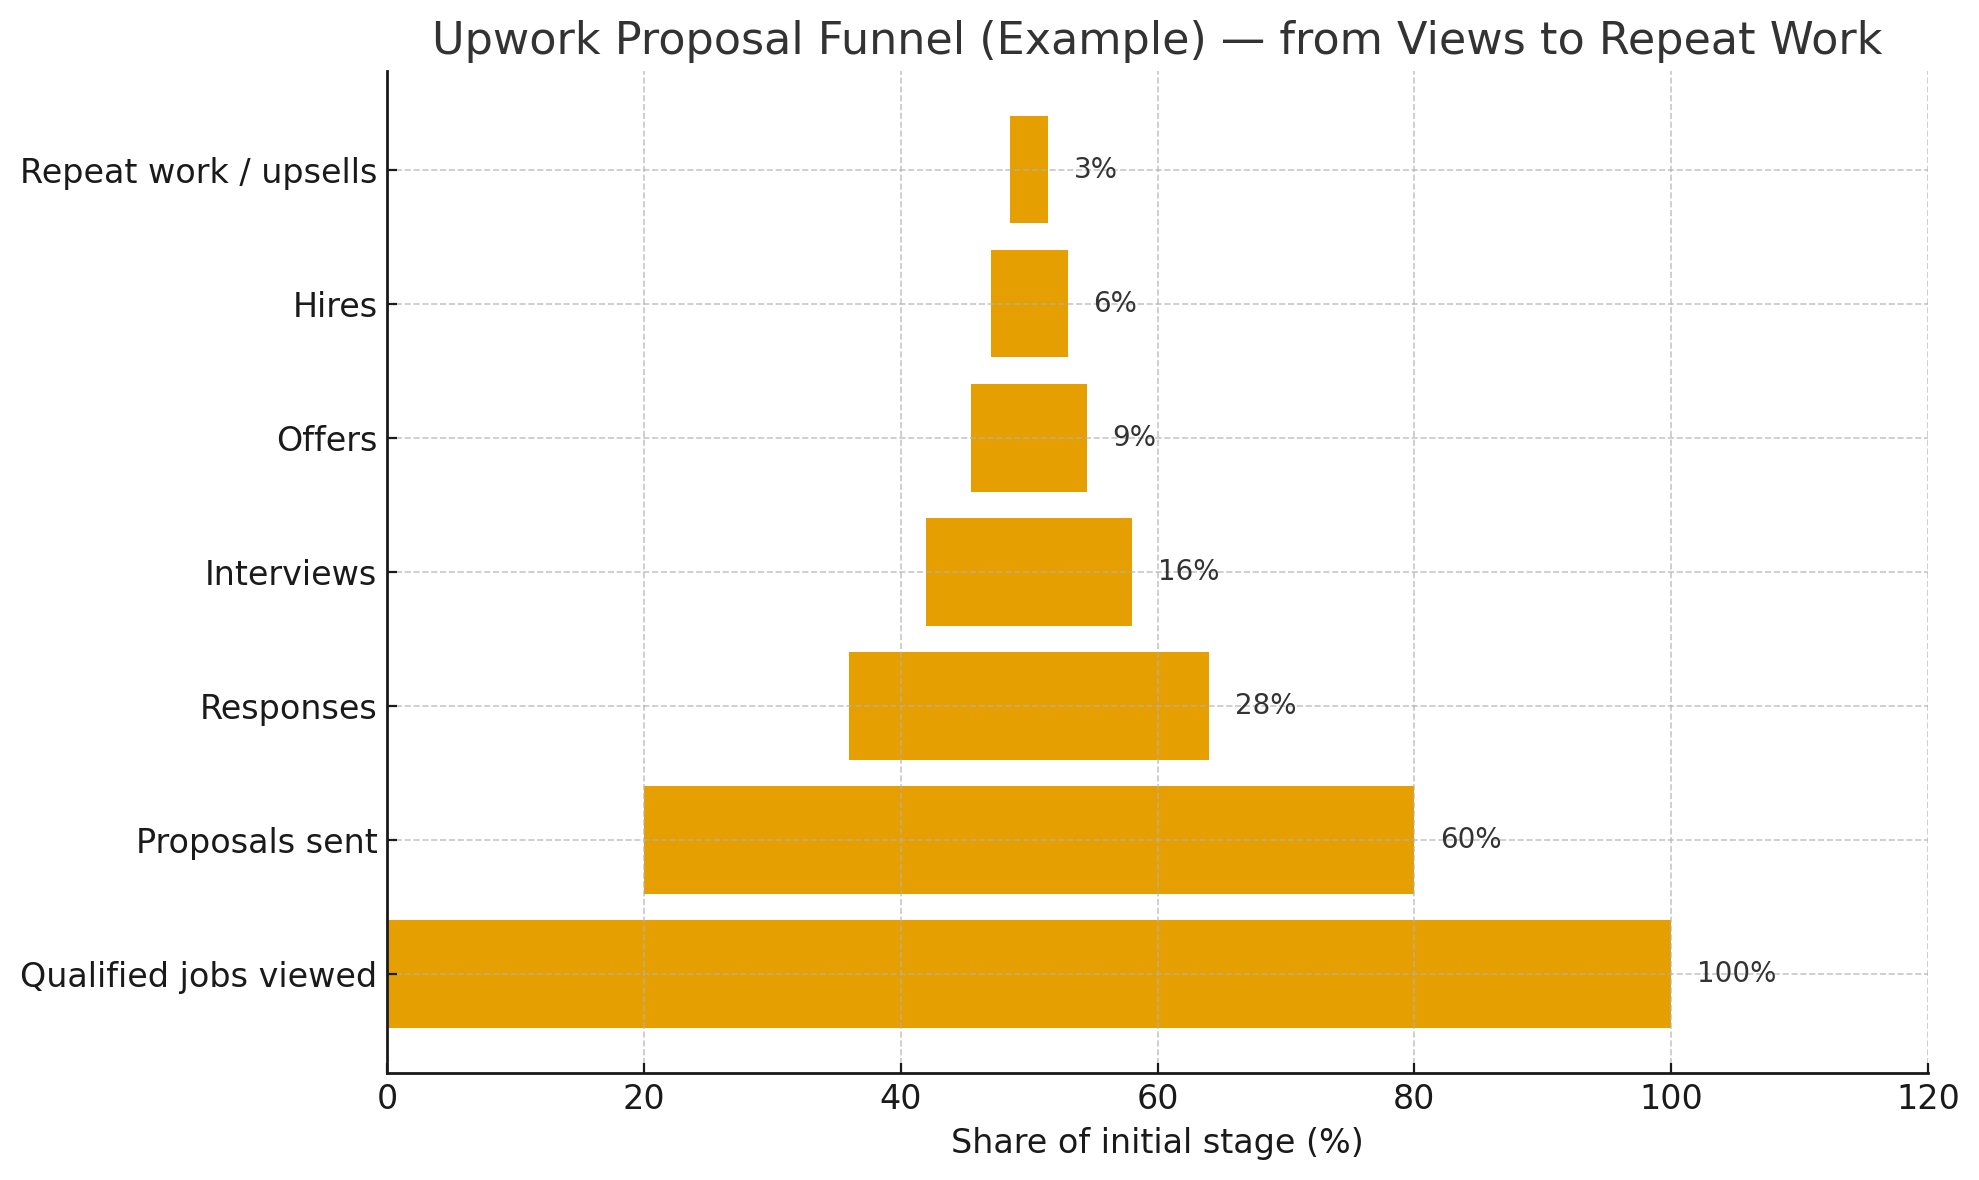
Every proposal travels a predictable path. Map these stages first:
- Qualified jobs viewed → 2) Proposals sent → 3) Client responses (message or invite) → 4) Interviews (live or async Q&A) → 5) Offers → 6) Hires → 7) Repeat work / upsells
Now attach conversion metrics:
- Response Rate = Client responses ÷ Proposals sent
- Interview Rate = Interviews ÷ Proposals sent
- Shortlist Rate (optional) = Shortlists ÷ Proposals sent
- Win Rate = Hires ÷ Proposals sent
When you track win rate upwork across time, cohorts (e.g., industry), and proposal styles, you’ll see where your leverage lives: often in the first 60 words and the first milestone you propose.
The core Upwork metrics that actually matter
Plenty of data points are nice-to-have. These are must-have:
- Response Rate – Are clients replying? This reflects relevance and your hook.
- Interview Rate – Are replies turning into real conversations? This reflects clarity and credibility.
- Win Rate – Are interviews converting to contracts? This reflects scope, pricing, and trust.
- Revenue per Proposal (RPP) – Total earnings ÷ Proposals sent. This shows whether incremental proposals are worth it.
- Cost per Proposal (CPP) – {Connects cost + your time cost + tools cost} ÷ Proposals sent. Be honest about time.
- ROI – (Revenue from proposals − Total proposal costs) ÷ Proposal costs. Keep it period-based (e.g., monthly).
- Time to First Response – Minutes/hours from submission to first client reply; faster responses usually correlate with higher win odds.
- Average Project Value – Mean revenue per hire; track by lane.
- Repeat Rate – % of clients who rehire within 90 days. Upwork fees drop on repeat business, improving ROI.
- Proposal Quality Score (PQS) – A quick 1–5 rubric you assign after drafting (details below). PQS is a leading indicator you control.
These upwork metrics form the backbone of your upwork proposal analytics dashboard.
If you want to see how these metrics translate into real outcomes, check our case study on 15 digital marketing agencies. They boosted PVR by 120%, LRR by 150%, and won $8M on Upwork by tracking and acting on the same metrics outlined here.
Build a simple tracking sheet (30 minutes, big payoff)
You don’t need complex software to start. A spreadsheet with 20 columns is enough to power solid upwork bid analytics:
- Admin: Date, Job ID/URL, Saved Search/Lane, Role, Client Country/Time Zone, Budget Type (hourly/fixed), Listed Budget/Rate.
- Freshness: Minutes from post to submission, Proposal count at submission.
- Personalization: Two client-specific details used (Y/N), Case study attached (Y/N), Artifact link (Y/N).
- Proposal Craft: Word count, Questions answered (Y/N), CTA offered (call/async), First milestone described (Y/N).
- Quality: Proposal Quality Score (1–5; see rubric).
- Outcomes: Response (Y/N), Interview (Y/N), Offer (Y/N), Hire (Y/N), Revenue (USD), Repeat within 90 days (Y/N).
- Timing: Time to First Response (minutes), Days to Hire.
- Costs: Connects used, Connects cost (USD), Time spent writing (minutes), Tooling cost allocation (USD).
This sheet lets you slice by lane (e.g., “Shopify CRO” vs. “React dashboard”), by hook (value-led vs. credential-led), and by artifact type (demo link vs. screenshot).
A five-point Proposal Quality Score (PQS)
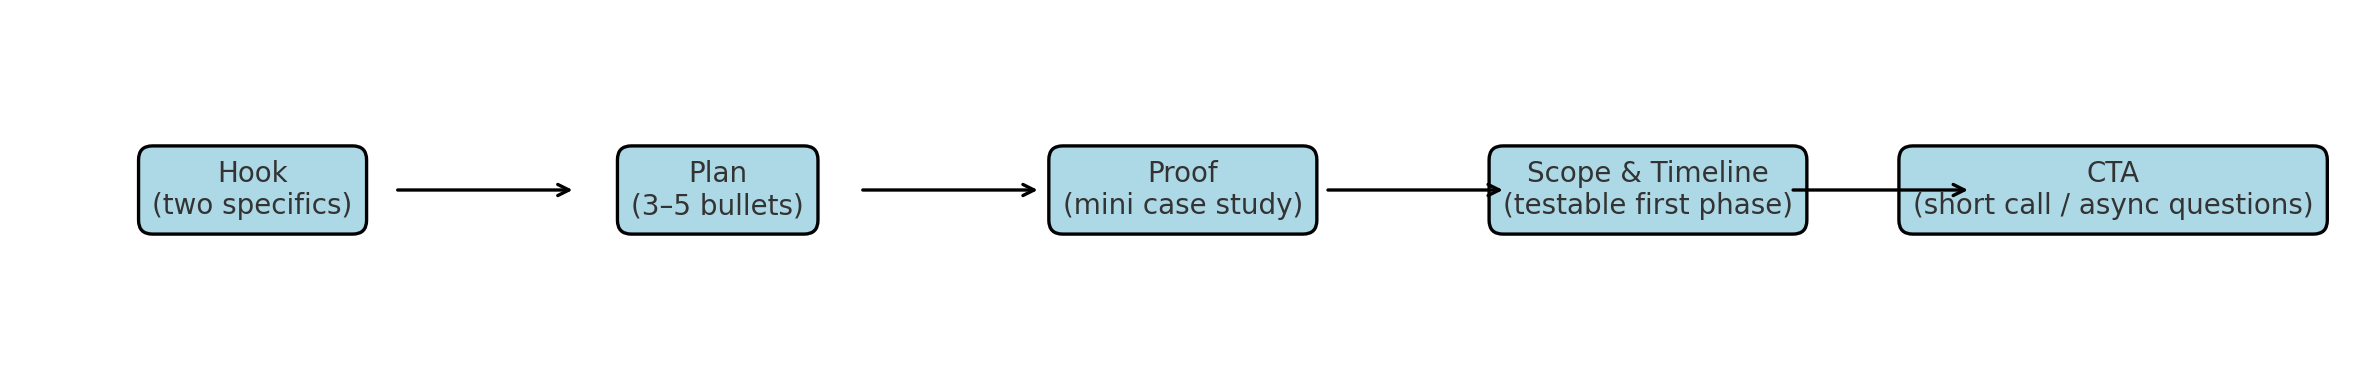
PQS keeps you honest about what you can control. Score each proposal 1–5:
- Hook (0–1): Two specifics from the brief in the first 2 sentences.
- Plan (0–1): Three bullets with a testable first milestone and acceptance criteria.
- Proof (0–1): One relevant result with a number and a link.
- Fit (0–1): Budget/timeline alignment and skills match explicitly stated.
- CTA (0–1): Clear next step (10-minute call or async Q&A).
Correlate PQS with response and win rates after 30–50 proposals. You’ll usually find that going from a PQS 3 → 4 is worth more than sending 2× as many low-quality proposals.
Want ready-made drafts to put this into action? Explore our 12 fill-in-the-blank Upwork proposal templates. They’re designed around the same PQS framework—so you can start testing high-quality proposals faster.
Benchmarks and realistic targets
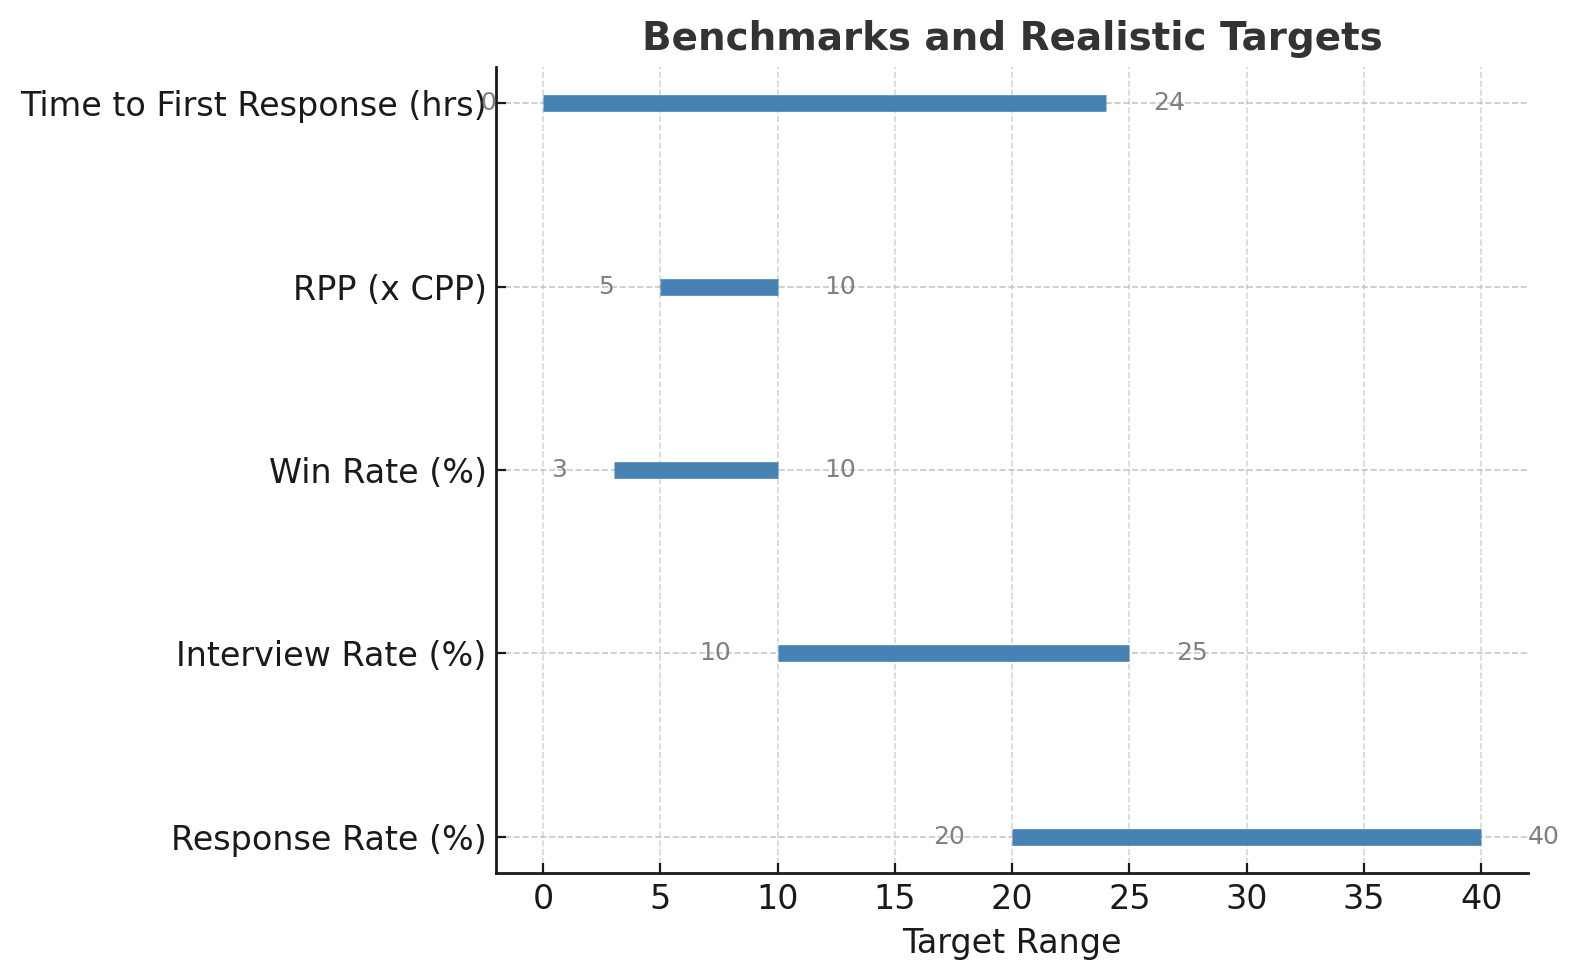
Benchmarks vary by category and price point, but as a starting target:
- Response Rate: 20–40% in focused niches (lower for broad categories).
- Interview Rate: 10–25%.
- Win Rate: 3–10% overall; 15–30% of interviews converting to hires.
- RPP: Enough to cover your CPP at a 5–10× multiple over time (especially with repeat work).
- Time to First Response: Under 24 hours on average; under 2 hours for P1 “fresh” posts.
Don’t chase someone else’s numbers. Set baselines for your lanes and iterate.
Cohorts and segmentation: where insights hide
Cohorting turns averages into action. Segment your upwork proposal analytics by:
- Lane/Service: e.g., “WordPress speed” vs. “Shopify CRO.”
- Industry: DTC ecommerce vs. B2B SaaS vs. nonprofits.
- Budget band: <$300, $300–$1k, $1k–$5k, >$5k.
- Job age: Submitted within 30 minutes vs. 30–120 minutes vs. next day.
- Proposal count at submission: “<5,” “5–10,” “10+.”
- Artifact type: Loom walkthrough, code repo, PDF case study, screenshot.
- Opening angle: “Plan-first” vs. “Proof-first” vs. “Credential-first.”
- Time zone overlap stated (Y/N).
Two or three cohorts will usually jump out as disproportionate winners. Put 80% of your energy there next week.
How to run weekly experiments (without guesswork)
Treat each week like an A/B test cycle:
- Pick one metric to move (e.g., Response Rate).
- Choose one variable to test (e.g., first line hook).
- Hold everything else constant for 20–30 proposals.
- Review Friday: Did the cohort lift your target metric by ≥20%? Keep or kill.
Experiment ideas tied to upwork metrics:
- Response Rate: Test a hook that cites two details from the post vs. one that leads with a micro-plan. Try adding a single screenshot/diagram.
- Interview Rate: Test including a 2-sentence first milestone with acceptance criteria vs. a generic plan.
- Win Rate: Test offering a low-risk paid “Phase 1” vs. a whole-project estimate.
- RPP/ROI: Test lane focus (narrow niche) vs. generalist proposals for a week.
Log experiments in your sheet with a simple tag (e.g., HOOK_v2), then read results by tag.
Calculating ROI (with connects and time included)
To keep upwork bid analytics honest, include all costs:
- Proposal Costs: Connects × price per connect + (Time to draft ÷ 60 × your internal hourly rate) + Tooling allocation.
- Revenue: Use cleared earnings for the period, not pending.
- ROI (period): (Revenue − Costs) ÷ Costs.
- Payback Time: Costs ÷ Average weekly profit.
Also calculate Lifetime Value (LTV) for clients sourced via proposals:
LTV = Average project value × Average number of projects per client × (1 − Upwork fee after threshold).
When repeat work increases, your ROI rises—often dramatically—because the acquisition cost (the proposal) isn’t paid again.
Time-to-first-response and proposal freshness
Fresh job posts with fewer than 5 proposals are your best bet. Add two columns:
- Minutes to Submit: From job post time to your submission.
- Proposals at Submit: The platform’s estimate when you hit send.
Now chart Response Rate by these two dimensions. You’ll likely see a steep drop after the first 60–90 minutes and when counts exceed 10 proposals. Use this to schedule two “Bid Sprints” daily to hit freshness windows.
Craft variables that move numbers
Your upwork proposal analytics should track variables you can change quickly:
- Opening line style: “Two details in your post stood out: …” vs. “Here’s a 3-step plan…”
- Proof type: Metric + link vs. named client + outcome vs. visual artifact.
- CTA: 10-minute call vs. async answers vs. “I’ll send a 2-slide mini-plan.”
- First milestone: Always include a small, testable paid task (audit, prototype, spec).
- Word count: 150–200 words usually beats walls of text on mobile.
- Attachments: Limit to two highly relevant samples, not a portfolio dump.
Each change should be testable and easy to log.
Build a one-page dashboard (no fancy tools required)
Create a summary tab that updates from your tracking sheet:
- Top row KPIs (7-day / 30-day): Proposals, Response Rate, Interview Rate, Win Rate, RPP, CPP, ROI.
- Trend lines: Response and Win Rates over 8 weeks.
- Cohort table: Lanes × Response Rate/Win Rate/RPP; highlight the top two lanes.
- Experiment tracker: Last 4 tests with target metric and result.
- Freshness heatmap: Response Rate by Minutes to Submit and Proposals at Submit.
This is your weekly operating system. If it doesn’t fit on one page, it won’t get reviewed.
What to do when numbers stall
Plateaus happen. Troubleshoot by stage:
- Low Response Rate: Your hook isn’t specific enough—or you’re bidding on off-lane jobs. Tighten filters and open with two details from the brief.
- Low Interview Rate with good responses: Your plan reads generic; add acceptance criteria and a tiny paid Phase 1.
- Low Win Rate with good interviews: Pricing or scope mismatch; propose options (MVP vs. full) and clarify outcomes.
- Low ROI with okay Win Rate: Projects too small; raise your minimum or target repeat-friendly work (retainers, maintenance).
- High CPP: You’re spending too long drafting; use templates and pre-written snippets.
Tie each diagnosis to a 7-day experiment, then measure again.
Example: A realistic analytics snapshot
- Period: Last 30 days
- Proposals sent: 62
- Responses: 18 → Response Rate: 29%
- Interviews: 10 → Interview Rate: 16%
- Hires: 4 → Win Rate: 6.5%
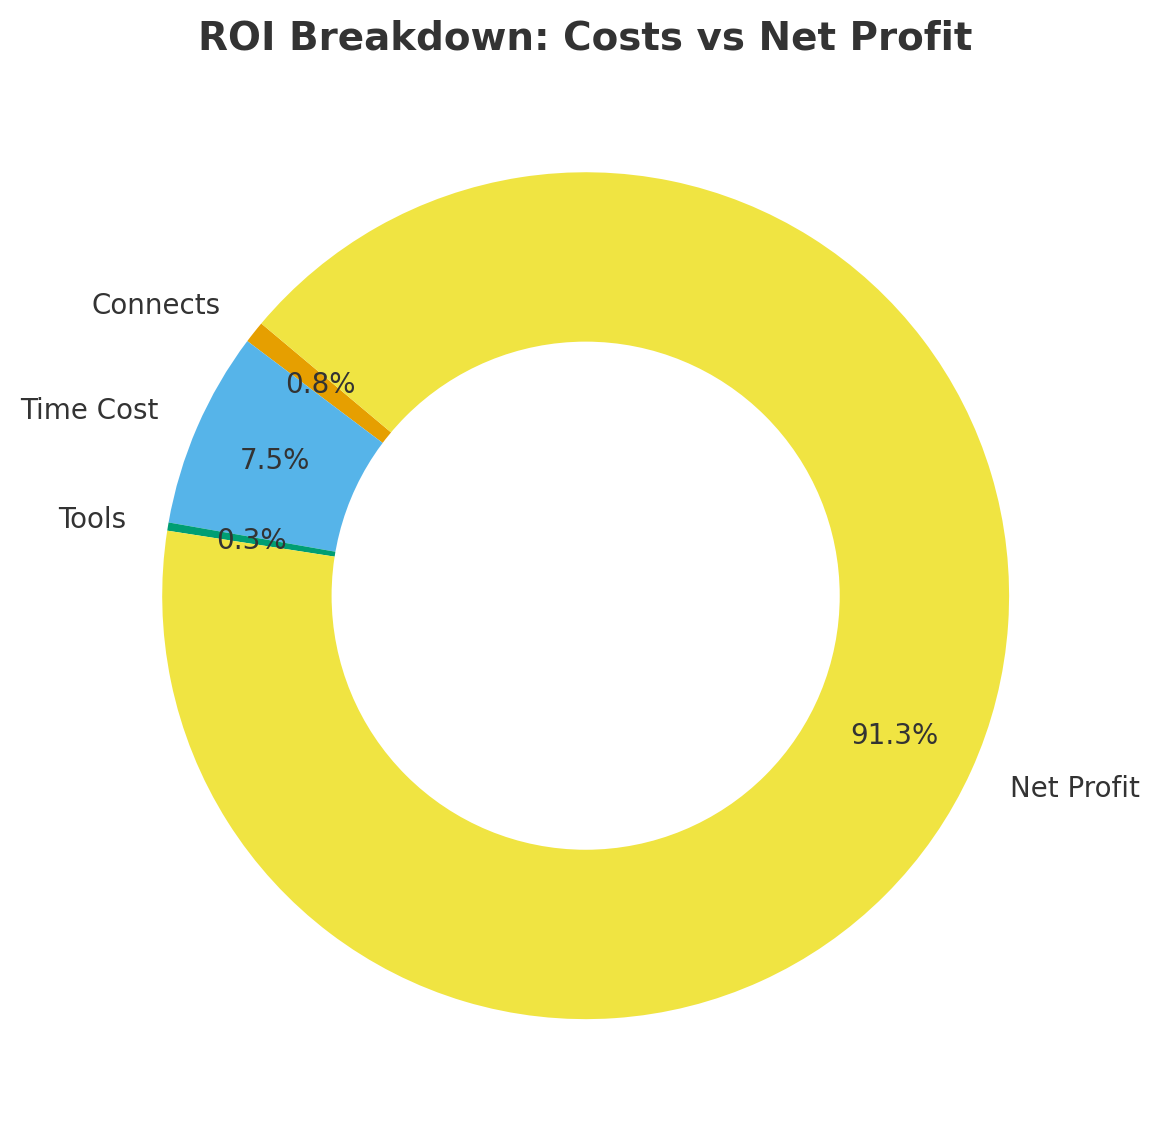
- Revenue: $6,400
- Costs: Connects $54 + Time 8 hours × $60 = $480 + Tools $20 → Total: $554
- RPP: $6,400 ÷ 62 = $103
- ROI: ($6,400 − $554) ÷ $554 = 10.5×
- Freshness: 3 hires came from proposals sent within 45 minutes; 1 came next day but had a strong artifact.
Takeaways: Double down on lanes that returned those 4 wins; schedule two daily Bid Sprints to exploit freshness; replicate the artifact that won the next-day job.
Governance: keep your analytics clean (and compliant)
- Data hygiene: Fill columns as you go; incomplete rows destroy insight.
- Privacy: Don’t store client names publicly; use IDs and sanitized notes.
- Consistency: Lock your PQS rubric and alter sparingly.
- Cadence: 15-minute weekly review; 45-minute monthly reset.
Good governance beats fancy tooling when it comes to upwork metrics.
Turn numbers into wins: your 7-day action plan
- Set up the sheet with the columns above; backfill the last 30 proposals.
- Define PQS and score recent drafts retroactively.
- Pick one lane with the best RPP; pause others for a week.
- Schedule two Bid Sprints daily to catch fresh posts.
- Run one experiment (e.g., “proof-first” opener + micro-milestone).
- Review Friday: Compare Response Rate, Interview Rate, Win Rate, and RPP to last week.
- Decide: Keep, tweak, or kill the experiment.
When you operate from data, you stop guessing. Upwork proposal analytics doesn’t make writing easy—it makes winning predictable. Instrument your funnel, run tight weekly tests, and let the numbers point you toward higher-signal work. That’s how upwork bid analytics helps you track win rate upwork, raise response rates, and grow ROI—without burning out or blasting generic pitches.