
TL;DR
- A sales forecast template that starts at CRM deals is already too late for an Upwork agency. Your pipeline begins two stages earlier, at proposals sent and reply rate.
- Use the interactive calculator below to forecast 90-day revenue from proposal volume, reply rate, close rate, and average contract value. No spreadsheet formulas required.
- Weighted pipeline (deal value multiplied by stage probability) beats raw pipeline. A $80,000 deal at 22% probability is worth $17,600, not $80,000.
- Anchor your reply-rate assumption in reality: across 133,872 GigRadar proposals (Dec 2025 to Feb 2026), reply rate settled around 6 to 9 percent, not the 20 percent most founders assume.
- Copy the seven-column template, plug in your real stage probabilities, and stop forecasting revenue off a gut number.
Most agency sales forecasts are wrong before the first number goes in, because they start at the wrong place. They open with a list of "deals" already sitting in a CRM and multiply by a round probability like 50 percent.
For an Upwork agency that number is fiction. Your revenue does not begin at a CRM deal. It begins the moment a freelancer spends Connects on a proposal, and the single input that decides whether that proposal ever becomes revenue is your reply rate.
Ignore that top-of-funnel stage and your forecast is a wish. Model it, and you get a number you can actually staff and spend against.
This guide gives you the calculator, the seven-column template, the stage-probability benchmarks, and the method to pick, so your next forecast lands inside 10 percent instead of 25. It sits alongside the other planning tools we build for agencies, like the break-even calculator and the CAC calculator.
Your forecast starts two stages before the CRM
A normal B2B sales forecast template assumes the top of the funnel is a qualified opportunity. An Upwork agency's real funnel has two stages sitting above that: proposals sent, and replies received.
Skip them and you are forecasting the visible 20 percent of your pipeline while ignoring the 80 percent that decides everything. Here is the full chain revenue actually travels through.
This is why two agencies sending the same 100 proposals a week can be $20,000 a month apart. The gap is almost never the closer. It is the reply rate at the very top.
So before you forecast a single dollar, you forecast the funnel. The calculator below does exactly that.
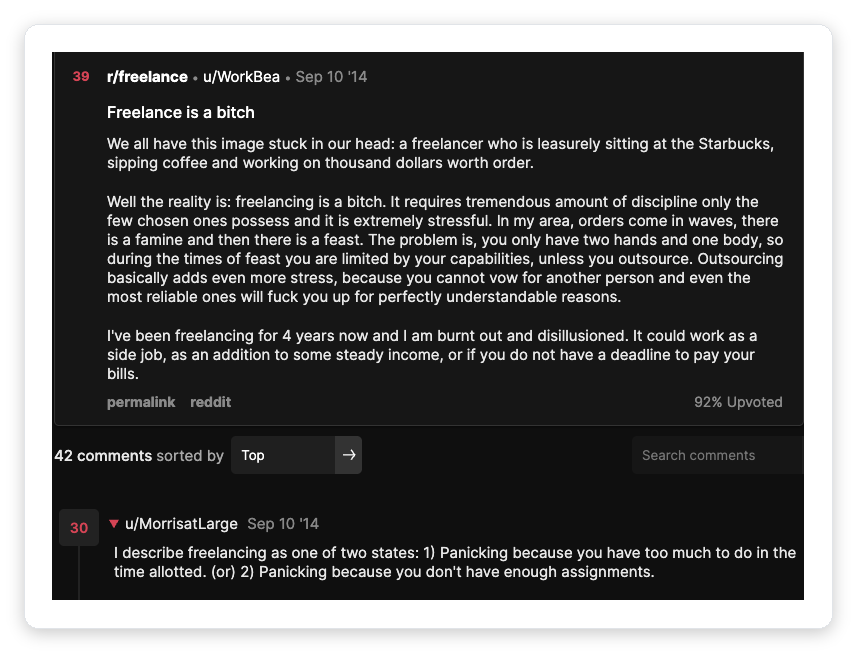
Skip the forecast entirely and you get the state every agency owner knows: revenue that arrives in waves you cannot predict. This is what the pain actually sounds like.
Forecast your next 90 days from proposal volume, not vibes
Interactive Tool
Upwork Agency Sales Forecast Calculator
Enter your funnel and revenue inputs. The tool projects new bookings month by month for the next 90 days, including recurring retainers, and tells you whether you are on track for your target.
GigRadar pipeline benchmark: 6–9%.
Weighted pipeline beats raw pipeline every single time
Once real opportunities exist, the second forecasting error shows up: summing raw deal values. A raw pipeline total treats a first-call deal and a verbal-commit deal as equally likely, which they are not.
Weighted pipeline fixes this. You multiply each deal by the historical close probability of the stage it sits in, then sum.
A $80,000 deal in Discovery at a 22 percent historical close rate contributes $17,600 to your forecast, not $80,000. That one adjustment is why weighted forecasts land closer to reality than raw ones.
The probabilities are not yours to invent. Pull the last 12 to 18 months of closed deals from your CRM and, for each stage, divide won deals by all deals that entered that stage. Until you have that data, these benchmarks are a defensible starting point.
| Pipeline stage | Benchmark close probability | What it means for the forecast |
|---|---|---|
| 1 · Prospecting | 8% | Barely counts. Value here is phantom pipeline. |
| 2 · Qualification | 22% | Real, but four in five still die here. |
| 3 · Solution design | 45% | Coin flip. Worth chasing hard. |
| 4 · Proposal / negotiation | 72% | Forecastable. Commit-category deals. |
| 5 · Verbal commit | 88% | Bank it, minus the slippage. |
Benchmark defaults from Prospeo's 2026 pipeline report. HubSpot ships different defaults (20/40/60/80/90); replace either set with your own win rates by stage.
The visual difference between raw and weighted is stark. Here is the same five-deal pipeline, scored both ways.
The seven columns every sales forecast template actually needs
You do not need a 12-tab financial model. A working sales forecast template is one clean row per open deal with seven columns, the same core fields Smartsheet and Fairview build their spreadsheets around. Everything else is decoration.
The account or project. One row, one deal.
A dropdown, never free text. "Qualified", "qualified", and "Qual" are how reporting dies.
Raw, unadjusted contract size. For retainers, use monthly value times expected months.
Auto-filled from a stage table. Avoid round numbers like 25, 50, 75; they signal nobody measured.
Deal value times probability. The single most important column in the model.
Drives the forecast month. A deal created today with a 47-day cycle closes next month, not this one.
Who moves it and what happens next. A deal with no next step is a dead deal.
Grab the template
Copy these seven columns straight into Google Sheets or Excel, or download the CSV. Two example rows are included so the weighted-value formula is obvious.
Which forecasting method actually fits your agency
There is no single correct method, only the right one for your data maturity and revenue mix. Pick the wrong one and you will either over-engineer a model you cannot maintain or under-model a business that needs the detail. Both Salesforce and Gong lean on the weighted-pipeline view as the backbone, and it pairs naturally with your broader sales plan template.
| Method | How it works | Best for |
|---|---|---|
| Weighted pipeline | Deal value × stage probability, summed by close month. | Agencies with a CRM and defined stages. The default for most. |
| Historical run-rate | Project last 12–18 months of closed revenue forward, adjust for churn and growth. | Retainer-heavy agencies with a stable base. |
| Sales-cycle length | Map pipeline created today to close months using average cycle time. | Longer, predictable cycles where timing matters. |
| Bottom-up (funnel) | Proposals × reply rate × close rate × deal value. The Upwork agency starting point. | Outbound-driven agencies. Forecasts before the CRM has deals. |
| Intuitive / rep judgment | Owner or closer calls each deal commit / best-case / omit. | A sanity check on top of a model, never the model itself. |
Historical methods break the moment your business changes. A new service line, a price increase, or a switch from inbound to outbound makes last year's run-rate a bad predictor. RevOps practitioners are blunt: no method guarantees accuracy, so combine at least two and reconcile the gap.
The strongest agency forecast runs two methods side by side: bottom-up funnel math for new business, and weighted pipeline for deals already in play. When they disagree by more than 20 percent, one of your assumptions is wrong, and finding which is the whole point.
Build your forecast in five steps
Here is the sequence, start to finish. It takes an afternoon the first time and 20 minutes a week after that.
Reply rate, reply-to-call, call-to-close, average contract value. Use the last 90 days, not your best week ever.
Plug volume and rates into the calculator above. That is your new-business forecast for the quarter.
Drop every live deal into the seven-column template with stage probabilities. Sum the weighted column by close month.
Layer existing retainers on top as a near-certain base, adjusted for known churn and expansions.
Compare forecast to actuals every month. If you are off by more than 20 percent twice running, your probabilities or your rates are wrong.
Forecast retainers and project work without mixing them up
Agencies live in two revenue worlds at once, and a single template that blends them lies to you. Project revenue books once. Retainer revenue recurs, so a retainer signed in month one keeps paying in months two and three.
Model them in separate lines. Project work uses the weighted-pipeline logic above. Recurring revenue uses run-rate: starting monthly value, plus new retainers, minus expected churn, plus expansions. If churn is your weak spot, tie the forecast to a real retention plan using our customer success plan template, and pressure-test the unit economics with the payback period calculator.
The calculator above already does this split. It books your project wins once and carries each retainer cohort forward for its full length, which is why the month-three number is usually the biggest.
Free for Upwork agencies
Your forecast is only as good as your reply rate
GigRadar runs your Upwork outbound through a real Business Manager account, so proposals go out at volume with human review on every one. Predictable proposal flow is what makes the top of your forecast reliable.
Get Your Free Agency Audit →The forecasting mistakes that blow up agency revenue
Most bad forecasts fail for the same handful of reasons. Fix these and you close most of the gap between your model and reality.
50 percent on everything is not a forecast, it is a coin toss dressed up in a spreadsheet. Use stage win rates from real closed data.
Every deal is not closing this month. Push close dates to match your true cycle length or the whole month-by-month view is fantasy.
Across 133,872 GigRadar proposals, reply rate settled around 6 to 9 percent, and stabilised near 6 to 7 percent after the first 50 sends. Build the forecast on that, not on your best month.
Best-in-class teams land inside 10 percent of actual revenue; the median is 20 to 25 percent off, and forecast accuracy tracks closely with pipeline hygiene in the Ebsta and Pavilion benchmarks. You only improve the number you measure.
None of these need a better tool. They need honest inputs, which is the entire discipline of forecasting. Get the reply rate right, weight the pipeline, separate recurring from one-time, and check yourself monthly.
Do that and the forecast stops being the number you dread in the board deck and becomes the number you plan hiring and spend around. That is the difference between running an agency and reacting to one.