Best Upwork Categories for Agencies 2026 ($50K+ Contract Map) — 2-minute walkthrough of the reply-rate map across 19 Upwork subcategories. Watch on YouTube
The Short Version
- Across 133,872 outbound proposals in GigRadar's pipeline (Dec 2025 to Feb 2026), the platform-mean reply rate is 7.45%. The categories everyone wants to be in (Web Development, Mobile, AI & ML) reply at 5.6% to 7.2%. Below average.
- The under-fished six (Game Design, Lead Gen & Telemarketing, Sales & Marketing Copywriting, Marketing PR & Brand Strategy, Information Security, Product Design) reply at 10.78% to 14.58%. Roughly double the saturated traps.
- Cost-per-reply varies 6.4× across categories. Web/Mobile/Software Dev costs $34/reply in Connects. Other Accounting & Consulting costs $8.28.
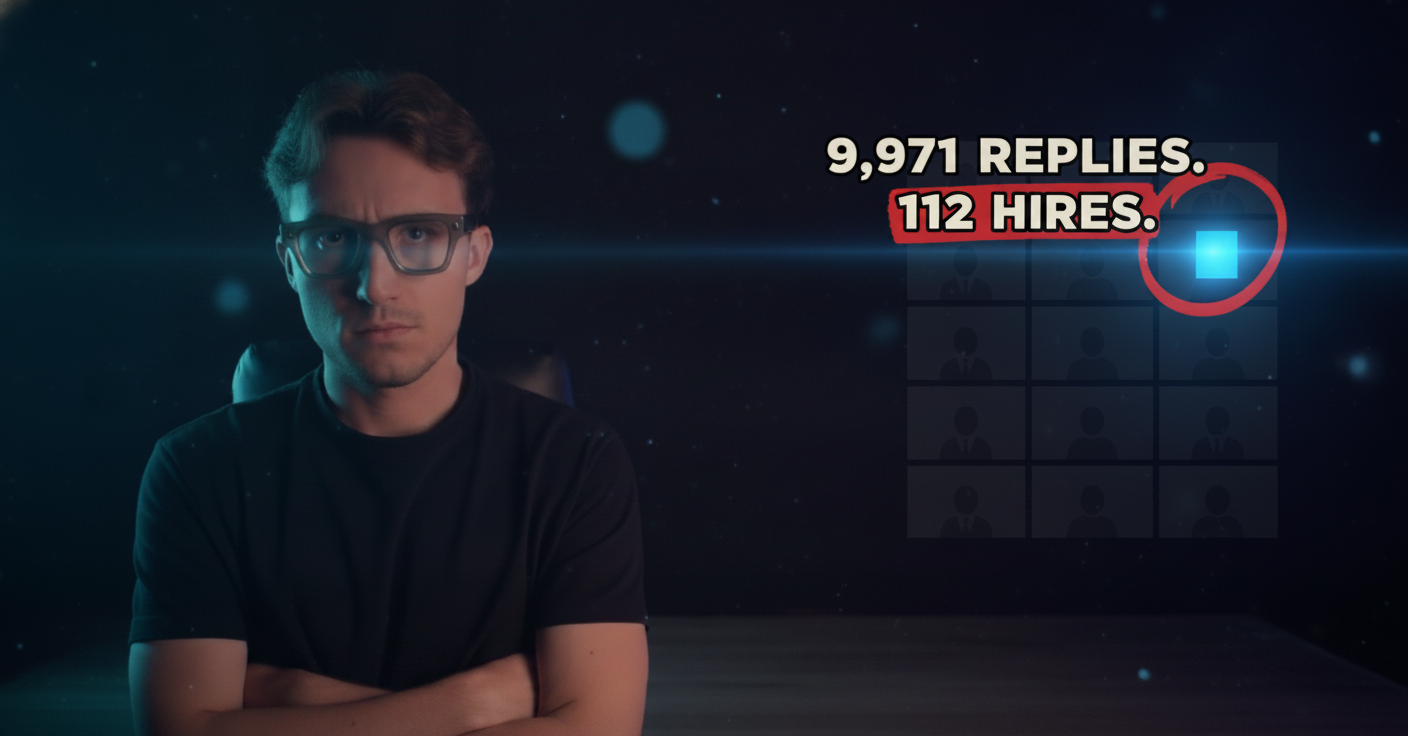
- Upwork's official "highest-paying jobs in 2026" list optimizes for the wrong metric. Hourly rate $50 to $200 doesn't matter when reply rate is 5%. You need the contract first.
- The $50K+ contracts agencies actually want live almost entirely in the Enterprise/Lifted tier, not the marketplace. Different qualification, different cash flow, different sales cycle.
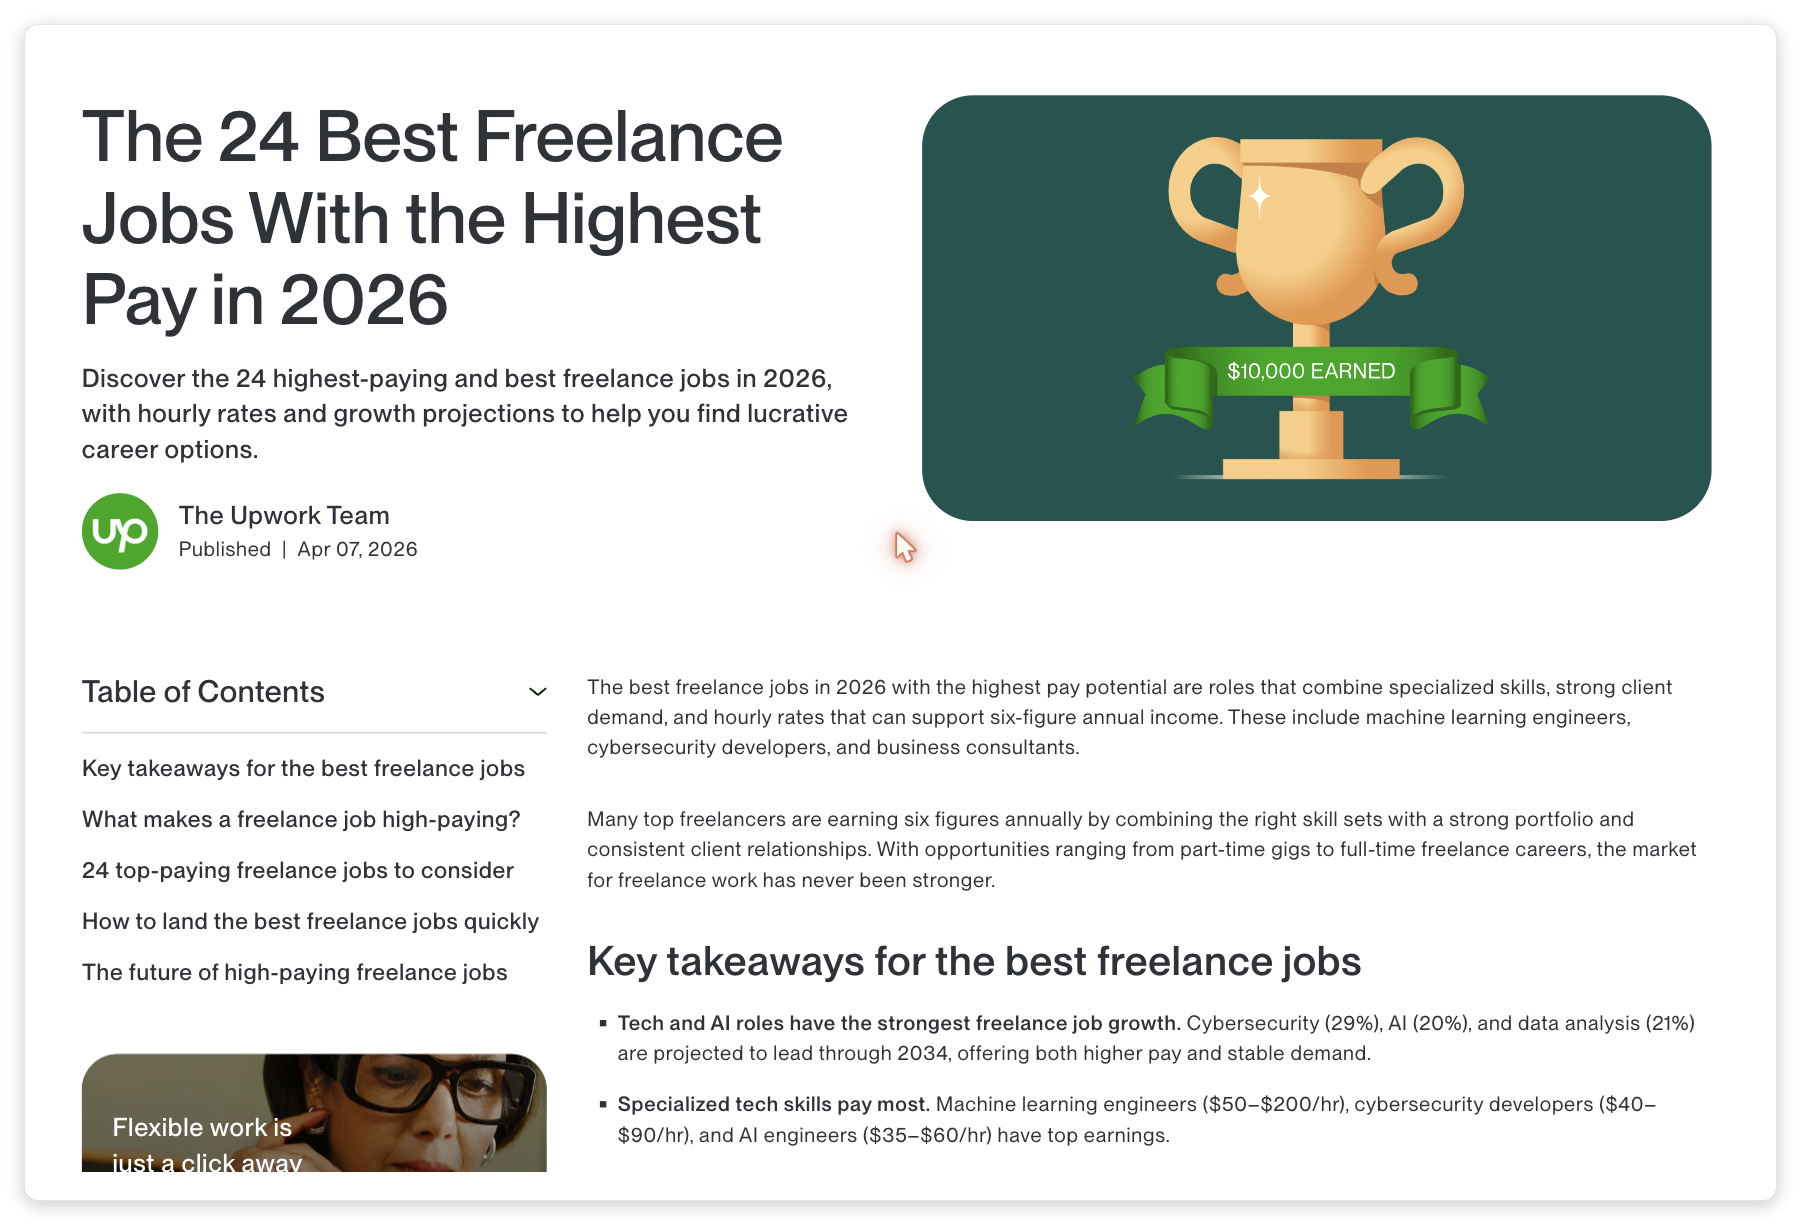
Open Upwork's "24 Best Freelance Jobs With the Highest Pay in 2026" and the top entries are Machine Learning Engineer ($50 to $200/hr), Cybersecurity Developer ($40 to $90/hr), AI Engineer ($35 to $60/hr).
Now look at where agencies actually win replies. Across 133,872 outbound proposals from GigRadar's pipeline over Dec 2025 to Feb 2026, the AI & Machine Learning subcategory replied at 7.21%, below the platform mean of 7.45%.
Web Development replied at 5.80%; Mobile Development at 5.60%.
Upwork sorts the marketplace by hourly rate ceiling, while agency owners pay for the floor. Those are two different rankings, and the gap between them is where the $50K+ contracts hide.
Interactive Tool
Category reply-rate & $/reply predictor
Pick your current Upwork category. See the expected reply rate, cost per reply, and the under-fished peer category you should test instead.
Web Development
5.80% reply rate
vs platform mean of 7.45%
Expected replies / week
2.3
Connect $ spend / reply
$34.21
Upwork sorts the marketplace one way. The data sorts it another.
Upwork's official "best freelance jobs" page leads with Machine Learning Engineer, Cybersecurity Developer, and AI Engineer. The ranking is hourly rate ceiling.
Hourly rate ceiling is what a freelancer hits when they already have a contract; reply rate is what gets them the contract. Those two metrics rank Upwork's categories in completely different orders.
A Machine Learning Engineer billing $150/hr earns nothing if they can't get a reply. The AI & ML subcategory (the one Upwork's "best paying" list anchors around) replies at 7.21% in GigRadar's pipeline over Dec 2025 to Feb 2026, below the platform-wide mean of 7.45% across 133,872 proposals.
Upwork ranks freelance jobs by the maximum hourly rate observed in completed contracts: a ceiling that says nothing about the probability an agency's proposal in that category gets a reply. In several major categories the two metrics correlate negatively.
The reply-rate map: 12 Upwork categories, ranked by what actually replies
This is the same dataset Upwork sees but never publishes: outbound proposal reply rate by category, from the agency side of the marketplace. Sample window is Dec 2025 to Feb 2026; platform-mean reply rate is 7.45%.
| Rank | Subcategory | Reply rate | vs platform mean | Verdict |
|---|---|---|---|---|
| 1 | Game Design & Development | 14.58% | +7.13pp | Under-fished |
| 2 | Lead Generation & Telemarketing | 14.38% | +6.93pp | Under-fished |
| 3 | Sales & Marketing Copywriting | 14.24% | +6.79pp | Under-fished |
| 4 | Marketing, PR & Brand Strategy | 13.64% | +6.19pp | Under-fished |
| 5 | Engineering & Architecture | 12.60% | +5.15pp | Under-fished |
| 6 | Information Security & Compliance | 11.21% | +3.76pp | Under-fished |
| 7 | Writing (SEO, Long-form, Content) | 11.31% | +3.86pp | Healthy |
| 8 | Product Design (UI/UX) | 10.78% | +3.33pp | Healthy |
| 9 | Customer Service & Tech Support | 10.31% | +2.86pp | Healthy |
| 10 | Accounting & Consulting | 9.36% | +1.91pp | Average |
| 11 | Virtual Assistance | 9.23% | +1.78pp | Average |
| 12 | Admin Support | 8.04% | +0.59pp | Average |
| 13 | Graphic, Editorial & Presentation Design | 7.50% | +0.05pp | At mean |
| 14 | AI & Machine Learning | 7.21% | -0.24pp | Saturated |
| 15 | Branding & Logo Design | 6.39% | -1.06pp | Saturated |
| 16 | Web & Mobile Design | 5.82% | -1.63pp | Saturated |
| 17 | Web Development | 5.80% | -1.65pp | Saturated |
| 18 | Mobile Development | 5.60% | -1.85pp | Saturated |
| 19 | QA Testing | ~5.20% | -2.25pp | Trap |
Source: GigRadar internal pipeline data, 133,872 outbound proposals, Dec 2025 to Feb 2026. Reply signal: client opened a chat or assigned the proposal to a hiring room.
The saturated traps: where every agency wants to be
Web Development, Mobile Development, Web & Mobile Design, AI & Machine Learning. These four sit below the platform mean despite being the most-promoted categories on Upwork's marketing pages.
Upwork's marketing optimizes for client acquisition, not freelancer success. Their In-Demand Skills 2026 report found AI Integration demand up +178% and AI Video Generation up +329%; the volume of work in AI is real and growing fast.
But the volume of agencies bidding for that work has grown faster. The 50% YoY GSV growth in AI is matched by a wave of agencies pivoting into the AI & ML subcategory, so the per-proposal probability of getting a reply has stayed flat or fallen despite the headline category growth.
Category-level dollar volume and per-proposal reply rate are two different metrics. A category can grow 50% YoY in client spend while the per-proposal reply rate falls, if bidder count grows faster than client count; AI & ML is currently in exactly that state.
The under-fished six: where clients still read cover letters
The six subcategories above 10% reply rate share a profile: demand exists and the bidder pool is shallow. Most agencies don't position into these because the names sound less prestigious than "AI Engineer."
Sales & Marketing Copywriting is the cleanest example. It sits inside the Writing parent category, and most agencies with copywriting expertise self-categorize as "Marketing" (treated as too generic) or "Writing" (treated as too unspecialized).
The clients posting in S&M Copywriting specifically want sales copy that converts, and they read every cover letter.
Game Design & Development sounds narrow but isn't. The category absorbs mobile game studios, AR/VR builds, gamified marketing for SaaS, and casino-style web games; the 14.58% reply rate reflects a real bidder shortage that most dev agencies skip after reading the category name.
Lead Generation & Telemarketing reads as low-prestige. The data disagrees: 14.38% reply rate, $10.24 per reply, the second-cheapest hire-conversion path on the platform.
Cost per reply: the 6× variance no one is pricing
Upwork charges $0.15 per Connect since the May 2025 fee restructure, and the average outbound proposal consumes 2.3 Connects after Connect-inflation across 2024 to 2026. That's $0.34 to $0.50 in raw cost per send.
Connect cost per reply varies 6× across categories; the reason is mechanical (same Connect spend, very different reply rate, so the dollar denominator changes).
| Category | Reply rate | Avg connects / send | $ per reply |
|---|---|---|---|
| Other – Accounting & Consulting | 9.0%+ | 1.77 | $8.28 |
| Market Research & Product Reviews | ~9% | 1.62 | $8.79 |
| Video & Animation | ~11% | 1.70 | $9.55 |
| Lead Generation & Telemarketing | 14.38% | 1.82 | $10.24 |
| Sales & Marketing Copywriting | 14.24% | 1.95 | $11.91 |
| Writing (SEO, Long-form) | 11.31% | 1.80 | $14.30 |
| Customer Service & Tech Support | 10.31% | 1.80 | $15.19 |
| Admin Support | 8.04% | 1.74 | $19.52 |
| IT & Networking | ~9% | 2.72 | $26.90 |
| Data Science & Analytics | 7.34% | 2.68 | $32.85 |
| Web, Mobile & Software Development | 5.80% | 2.33 | $34.21 |
| QA Testing | ~5.20% | 2.96 | $53.04 |
Source: GigRadar internal pipeline data, 133,872 outbound proposals, Dec 2025 to Feb 2026. $0.15 per Connect, May 2025 fee schedule.
A team that runs all their scanners in Web Development pays $34.21 per replied conversation, while a team targeting Video & Animation or Lead Generation pays $9.55 to $10.24. Same workflow, same Connect budget, 3 to 4× the replies.
QA Testing is the worst on the platform at $53.04 per reply, 6.4× more expensive than the cheapest niche. The combination of low reply rate and high Connect cost (clients in QA tend to require longer-form CLs that trigger Boost) makes it the single most expensive category to fish in.
Since May 2025, Upwork charges 0% to 15% in variable freelancer fees that resolve at proposal-submission time, where commodity categories (general VA, basic content) trend toward 15% and scarce categories (senior engineering, regulated industries) sit at 5% to 10%. Stack the variable fee on top of the Connect-cost gap and the saturated/under-fished delta is closer to 8× in actual margin terms.
Where the $50K+ contracts actually live: Enterprise and Lifted
The $50K+ contracts agencies dream of don't sit in the marketplace at all. They sit in Upwork's Enterprise tier, which the company spun out as a wholly-owned subsidiary called Lifted on Aug 19, 2025.
Marketplace and Lifted run on different rate structures, different procurement cycles, and different cash-flow assumptions. The same agency profile is priced very differently across the two.
| Role | Marketplace rate | Enterprise/Lifted rate | Multiplier |
|---|---|---|---|
| Senior full-stack developer | $50 to $80/hr | $120 to $180/hr | 2.3× |
| Brand designer | $45 to $70/hr | $110 to $160/hr | 2.3× |
| Marketing / GTM consultant | $60 to $90/hr | $140 to $220/hr | 2.4× |
| Fixed-price project (typical) | $5,000 to $15,000 | $50,000 to $250,000 | 10× to 17× |
| Payment terms | Escrow, 5 to 7 days | NET-30 to NET-45 | n/a |
Source figures: GigRadar's Upwork Enterprise / Lifted analysis, May 2026.
The cash-flow side is where most agencies break. A five-person agency winning a $150,000 Lifted project must float $30,000 to $50,000 of payroll for 30 to 45 days before the client's accounts-payable cycle clears, and the single most common failure mode for agencies transitioning from marketplace to Lifted is running out of cash three weeks into a winning contract.
Lifted qualification realistically takes 9 to 18 months of marketplace activity, Top Rated status, $50,000+ in lifetime earnings, and a clear niche specialization. It's not a category you bid into; it's a tier you earn into, and we cover the full transition in our Lifted enterprise breakdown.
If your goal is winning a $50K+ contract, the marketplace fixed-price ceiling is about $15K. The path to $50K+ is either (a) a multi-month retainer billed monthly inside the marketplace, or (b) Lifted qualification; see our retainer math piece for the math on option (a).
The AI category paradox: +50% growth, below-mean reply rate
Upwork's Q4 2025 earnings disclosed that AI-related Gross Services Volume crossed $300M on an annualized basis, up 50% YoY. Their In-Demand Skills 2026 report shows AI Video Generation up +329%, AI Integration up +178%, AI Data Annotation up +154%.
All true. None of it helps a generalist agency pivoting into AI & ML to win replies.
The growth is in adjacent skills, not the dedicated AI & ML subcategory:
- AI Apps & Integration sits inside Web/Software Dev.
- AI Video Generation sits inside Design & Creative.
- AI Data Annotation sits inside Data Science.
The dedicated AI & ML subcategory is where everyone pivots into and gets ignored.
The 44% earnings premium is the move: Upwork's own research finds that AI-integrated versions of existing roles ("AI-augmented copywriting", "AI-integrated web development") earn 44% more per hour than the same role without AI. That premium goes to the AI-integrated version of existing categories, not to the dedicated AI & ML subcategory.
A copywriting agency adding "AI-augmented sales copy" sits in Sales & Marketing Copywriting (14.24% reply rate) and prices the AI premium on top. A web dev agency adding "AI integration in web apps" stays in Web Development and bids the AI premium on contracts that ship; neither pivots into the saturated AI & ML category.
Free reply-rate audit
Find the under-fished niches in your skill set
We run your existing Upwork scanners against the full reply-rate map and identify the 2 to 3 under-fished subcategories your team can pivot into without abandoning your core skill. Free, 30 minutes.
Get your free agency audit →Every category has a different recipe (CL length, rate, bid)
Reply rate is the spine, but the optimal recipe inside each category differs sharply. The same cover-letter template that wins at 20% reply in Sales & Marketing can reply at 5% in Mobile Development; optimal hourly rate shifts by 5× across categories and optimal fixed bid varies 8×.
This is the most underappreciated finding in the 133,872-proposal sample. A team running one template across all their scanners is paying the average price across optima that point in opposite directions.
| Category | Optimal CL length | Optimal opener | Optimal hourly rate band | Optimal fixed bid |
|---|---|---|---|---|
| Sales & Marketing | <100 words | "I made a quick Loom for you…" | <$15/hr | $250–$499 |
| Design & Creative | <100 words | "I made a quick Loom for you…" | $15–$24/hr | $500–$999 |
| Data Science & Analytics | <100 words | "I recently completed [similar]…" | $50–$74/hr | $250–$499 |
| Web, Mobile & Software Dev | 100–199 words | "I can deliver / I can help…" | $75–$99/hr or $150+/hr | $250–$499 |
| IT & Networking | 100–199 words | custom, no template | $50–$74/hr | <$250 |
| Engineering & Architecture | 300–499 words | technical specs + materials | $50–$74/hr | varies by sub |
| Accounting & Consulting | 100–199 words | custom, no template | <$15/hr | <$250 |
| Writing | 100–199 words | Loom mention or sample link | $15–$24/hr | $250–$499 |
Source: GigRadar internal pipeline data, 133,872 outbound proposals, Dec 2025 to Feb 2026. Best-performing recipe per category by reply rate (n ≥ 200 in best cell).
Three patterns matter:
- Fixed bids in the $250 to $999 range win nearly every subcategory. Bids above $2,500 tank reply rate 5 to 15× in nearly every sub.
- Hourly rate optima are bimodal in dev (cheap or premium, never middle) and uniformly cheap in marketing/admin: under $15/hr beats every other band.
- Engineering & Architecture is the one category where long CLs (300 to 499 words) decisively win, because clients want specs.
The single best (category × experience × rate) cell
Across the full dataset, the highest reply-rate cell with n ≥ 1,000 is "Sales & Marketing × Intermediate × under-$15/hr" at 14.89% reply (n=1,182). That's an Intermediate-tier marketing freelancer bidding sub-budget; the combination wins because the rate signals hunger, the experience tier signals competence, and the category signals client appetite for first-touch outreach work.
The decision matrix: pick your category
Each quadrant below is sorted by current reply-rate band, and each has a different play.
Already in an under-fished niche
Game Design, Lead Gen, S&M Copywriting, Marketing PR: stay and tighten the recipe (CL length, rate band, fixed bid) using the category table above.
In a healthy niche
Info Sec, Product Design, Writing, Customer Service, Engineering: stay and test one adjacent under-fished niche for 60 days as a side bet.
At or near platform mean
Admin Support, VA, Branding, Graphic Design, Accounting: the Connect economics are tolerable but capped, so move 30% of scanner volume into an adjacent higher-reply niche.
In a saturated trap
Web Dev, Mobile Dev, AI & ML, QA Testing: reposition as "Information Security with [your stack]", or own a niche-by-name ("highest-rated Trading Automation developer") and accept that you'll fight for every reply.
The 90-day reset, if you're in a saturated trap
Pull last 90 days of GigRadar scanners and tally what percentage of your outbound goes into Web Dev / Mobile / AI&ML / Web & Mobile Design; if it's over 50%, that's your problem.
Web Dev shops → Information Security & Compliance or Desktop App Development; Mobile shops → Game Design; Branding/Logo shops → Marketing, PR & Brand Strategy. Don't kill the old scanner, just add one.
If it's outperforming your saturated scanner by 1.5× or more, double its scanner budget, cut the saturated scanner by 30%, and bank the Connect savings.
Niche-by-name positioning beats every CL tactic in saturated categories. "We do Information Security audits for SaaS" outperforms "We are a full-stack dev shop" even when the team is the same five people.
The uncomfortable truth: categories, not skills, are the lever
Most agency-improvement advice focuses on the cover letter: write tighter, lead with a Loom, mention the client's name. All of that helps, and we've documented the optimal recipe in our CL playbook.
The data is unambiguous: the category your scanners point at is a larger lever than anything inside the cover letter.
None of the top-decile teams are forced into the saturated subcategory exclusively. You can't out-write the bidder count, but you can out-position it.