
Marketing Agency Pricing 2026: What to Charge (Real Data). A 2-minute walkthrough of the pricing barbell, the reply-rate data behind it, and the calculator. Watch on YouTube
TL;DR
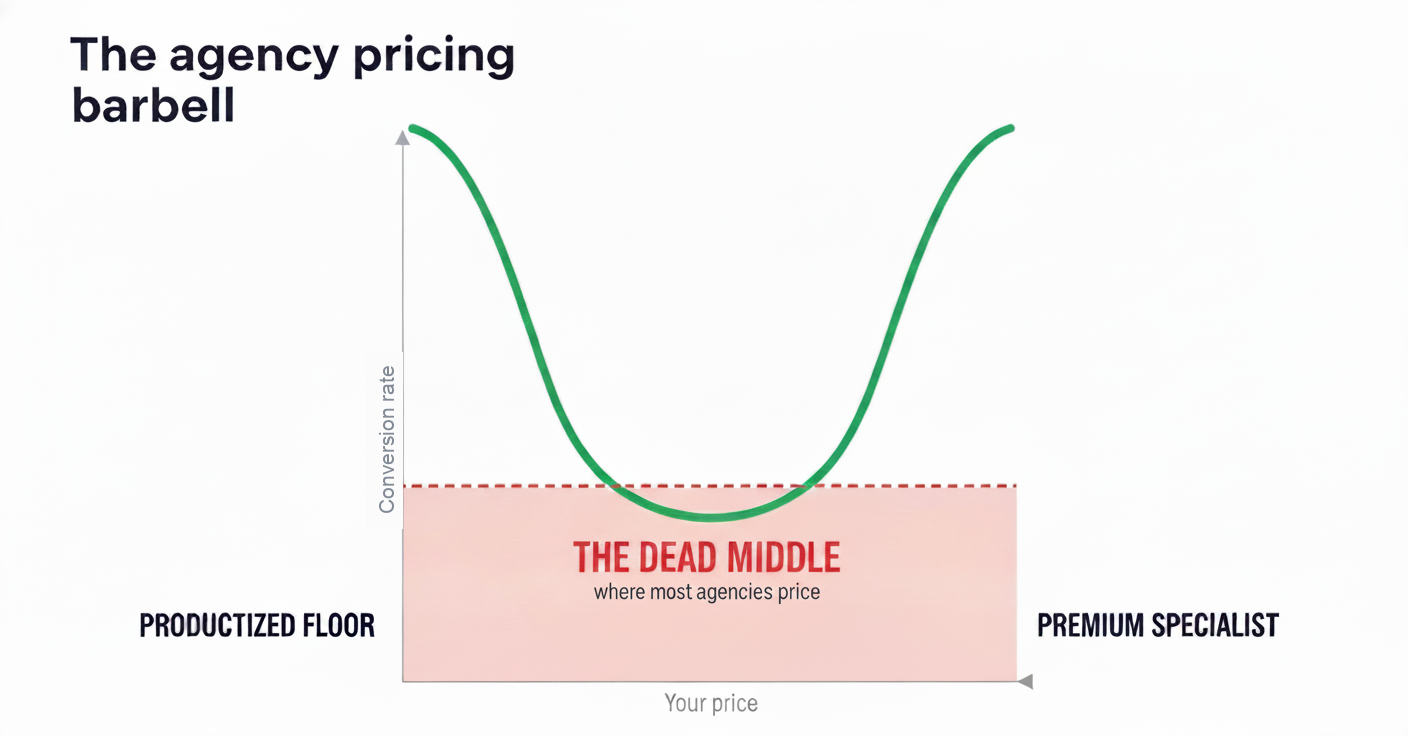
- The average agency SEO retainer is $3,209/month, but the single most common price is $501 to $1,000. Marketing agency pricing is not a bell curve, it is a barbell.
- In GigRadar's proposal data, quoting 95 to 105% of the client's posted budget replies at 8.8%. Undercutting by more than half replies at 20.6% and quoting 2 to 5 times the budget replies at 16.4%, both on small samples.
- Bidding 1.0 to 1.2 times what a client historically pays their hires is the worst-converting ratio in our data at 5.4%.
- The margin data agrees. Agencies that narrowed their service list averaged 30% net margins against an industry average of 13%.
- Use the calculator below to find which band your effective hourly rate lands in, then move to an edge on purpose instead of drifting to the median.
The average agency SEO retainer sits at $3,209 a month. The median marketing job posted on Upwork last month carried an hourly floor of $5.40.
Both numbers are from the last twelve months, and both are real.
Marketing agency pricing is the decision about which of those two markets you are actually selling into. Most agencies never make it, and end up priced in the gap between them, where neither buyer says yes.
I run GigRadar, and we watch that gap get crossed roughly a hundred thousand times a quarter. Our pipeline data shows something that no agency pricing guide will tell you: the price closest to the market median is the price with the worst conversion rate.
The three numbers that set the market in 2026
Start with what buyers see. Ahrefs surveyed 439 SEO service providers and published the full distribution, which is rare and useful.
The average is more than three times the mode. That only happens when a thin premium tail drags the mean upward while most of the market clusters near the floor (Ahrefs SEO pricing survey, n = 439).
A separate survey of 260 agencies found the same clustering from the other direction: 64% charge under $1,000 a month and 60% set their hourly rate under $100 (SE Ranking agency survey).
The 4A's runs the other side of this market. Its 2025 Billing Rate Benchmark Survey covers 36,000+ data points across 886 rate cards and 238 positions, and it still reports hourly billing as the most widely used methodology for benchmarking agency services (4A's, October 2025).
None of those surveys describe the market an Upwork agency competes in. This is the same search, live, three minutes apart.
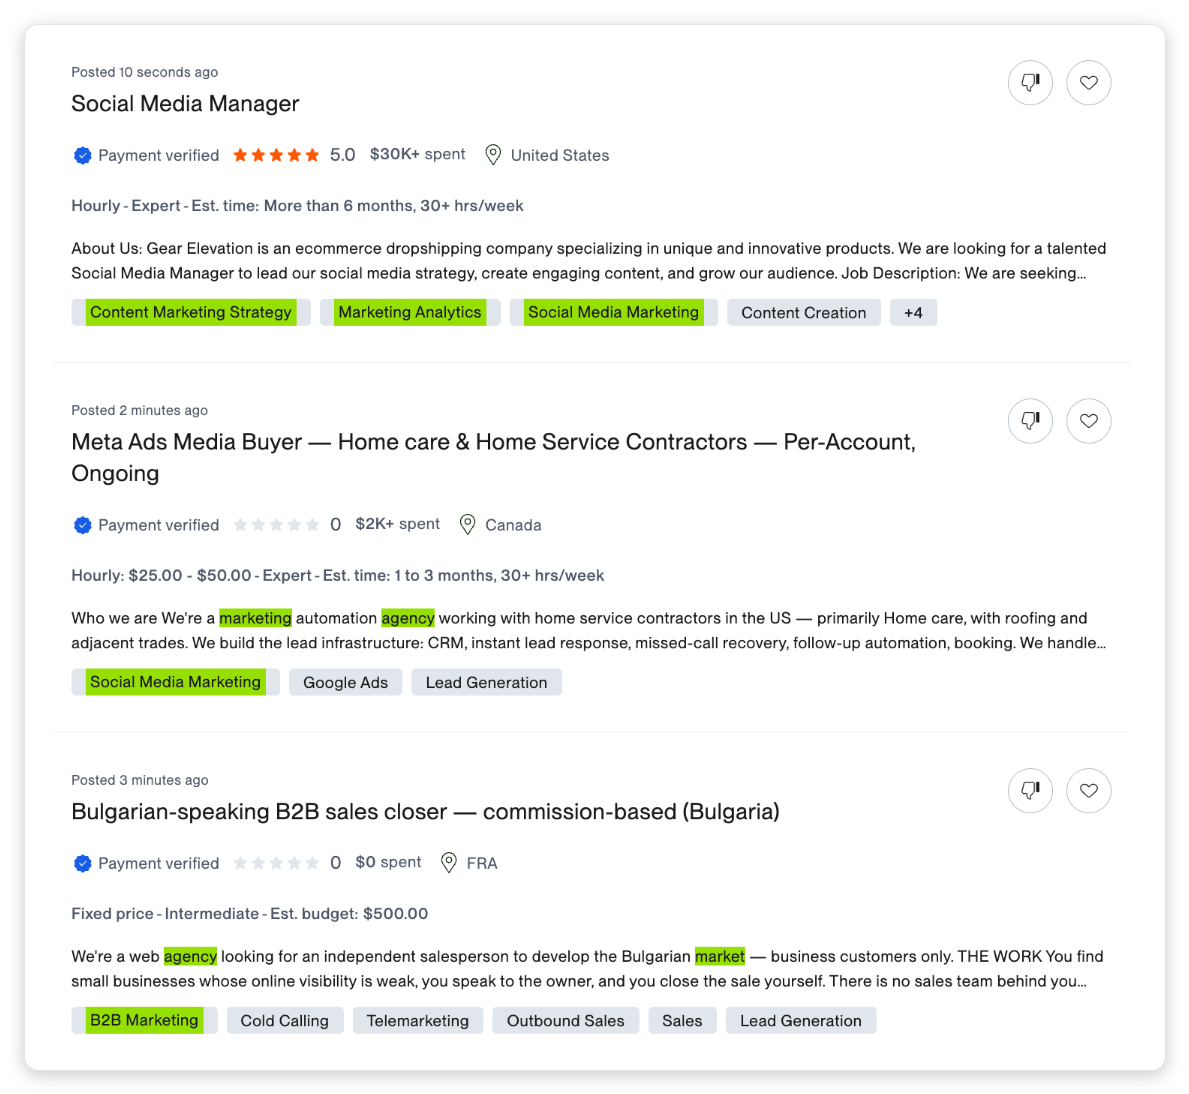
Look at the top card. An open-ended expert hourly role from a client who has already spent over $30,000 on the platform, sitting next to a $500 fixed-price posting from a client who has spent nothing.
Same search results page, two completely different buyers. Quoting one price to both is how agencies end up in the flat part of the curve.
Any pricing guide quoting a single "national median hourly rate" for agencies is quoting a secondary source. The 4A's publishes the methodology and the sample, not a public headline median.
Ask where the number came from before you anchor your rate card to it.
Find your pricing position before you read the rest
This calculator converts your retainer into an effective hourly rate, shows your gross delivery margin, and names the band you are competing in. Gross delivery margin is not the same measure as the 13% after-tax net figure further down.
Free Interactive Tool
Four inputs. Tells you your effective hourly rate, your gross delivery margin, and which pricing band you are competing in.
What to charge by service line
The surveys above are SEO-heavy because SEO is the only service line with public distribution data. Here is the wider picture, with the source on every row so you can check the methodology yourself.
| Service line | Typical engagement | Source |
|---|---|---|
| SEO | $501 to $1,000/mo most common, $3,209/mo average, $2,501 to $5,000 most common per project | Ahrefs, n = 439 |
| SEO (cross-check) | 64% of agencies under $1,000/mo, 60% under $100/hr | SE Ranking, n = 260 |
| B2B content marketing | $5,000 to $15,000/mo for ongoing work, $100 to $250/hr with an average near $125 | Column Five, May 2026 |
| Paid media | Roughly 10 to 30% of managed ad spend, tiering down as budgets grow | Swydo, 2026 |
| Social media | $500 to $20,000+/mo, the widest spread of any service line | Swydo, 2026 |
| Web design | $3,000 to $150,000+ per project rather than monthly | Swydo, 2026 |
| PR | $2,000 to $90,000+/mo depending on scope and market | Swydo, 2026 |
Notice what the spread does. Social media runs from $500 to $20,000 for work that carries the same job title, which means the price is set by positioning rather than by the deliverable (Column Five's 2026 content pricing breakdown shows the same pattern in content).
Do not pick the midpoint of your row. Pick the end you can defend, then use the calculator above to check the margin holds at that price.
Matching the client's budget is the worst-converting quote you can send
Here is the part no benchmark report covers, because no benchmark report has the outcome data attached to the price.
GigRadar's pipeline carried 59,339 fixed-price proposals with a recorded bid in January and February 2026. On 10,091 of them the client had also posted a budget, so we could compare the two numbers directly.
Reply rate is not a straight line against price. It has two peaks.
Quoting inside the client's stated budget is the safe move, and it is what the overwhelming majority of fixed-price proposals in our data do. It replies at 8.8%.
Undercutting by more than half replies at 20.6%, and quoting two to five times the posted budget replies at 16.4%. Conformity loses to both extremes.
A quote that matches the budget carries no information. A quote far below it says "productized, I do this every week."
A quote far above it says "you have mis-scoped this and I am the person who knows why." Buyers act on positioning, not on arithmetic.
The single worst price is 1.1 times what the client already pays
We ran the same question from the client's side. The client's average paid rate to previous Upwork hires was visible on 56,643 proposals, and on 40,082 of those we could line that up against the rate the agency quoted.
| Your quote vs the client's usual paid rate | n | Reply rate |
|---|---|---|
| Under 0.5x (steep discount) | 1,648 | 6.7% |
| 0.5 to 0.8x | 3,675 | 6.6% |
| 0.8 to 1.0x | 3,333 | 6.4% |
| 1.0 to 1.2x (just above) | 3,560 | 5.4% |
| 1.2 to 1.5x | 4,754 | 5.7% |
| 1.5 to 2x | 6,037 | 6.5% |
| 2 to 5x (premium) | 12,492 | 6.9% |
| Over 5x | 4,583 | 7.7% |
Charging slightly more than a client is used to paying is the most expensive small decision in agency pricing. It reads as expensive without reading as different.
If you are going to raise a price, raise it far enough that the buyer has to re-categorise you. Our value-based pricing breakdown covers how to build the case for that jump.
An agency owner posted the cleanest version of this argument in r/agency last December, and the thread has 162 comments arguing about it.
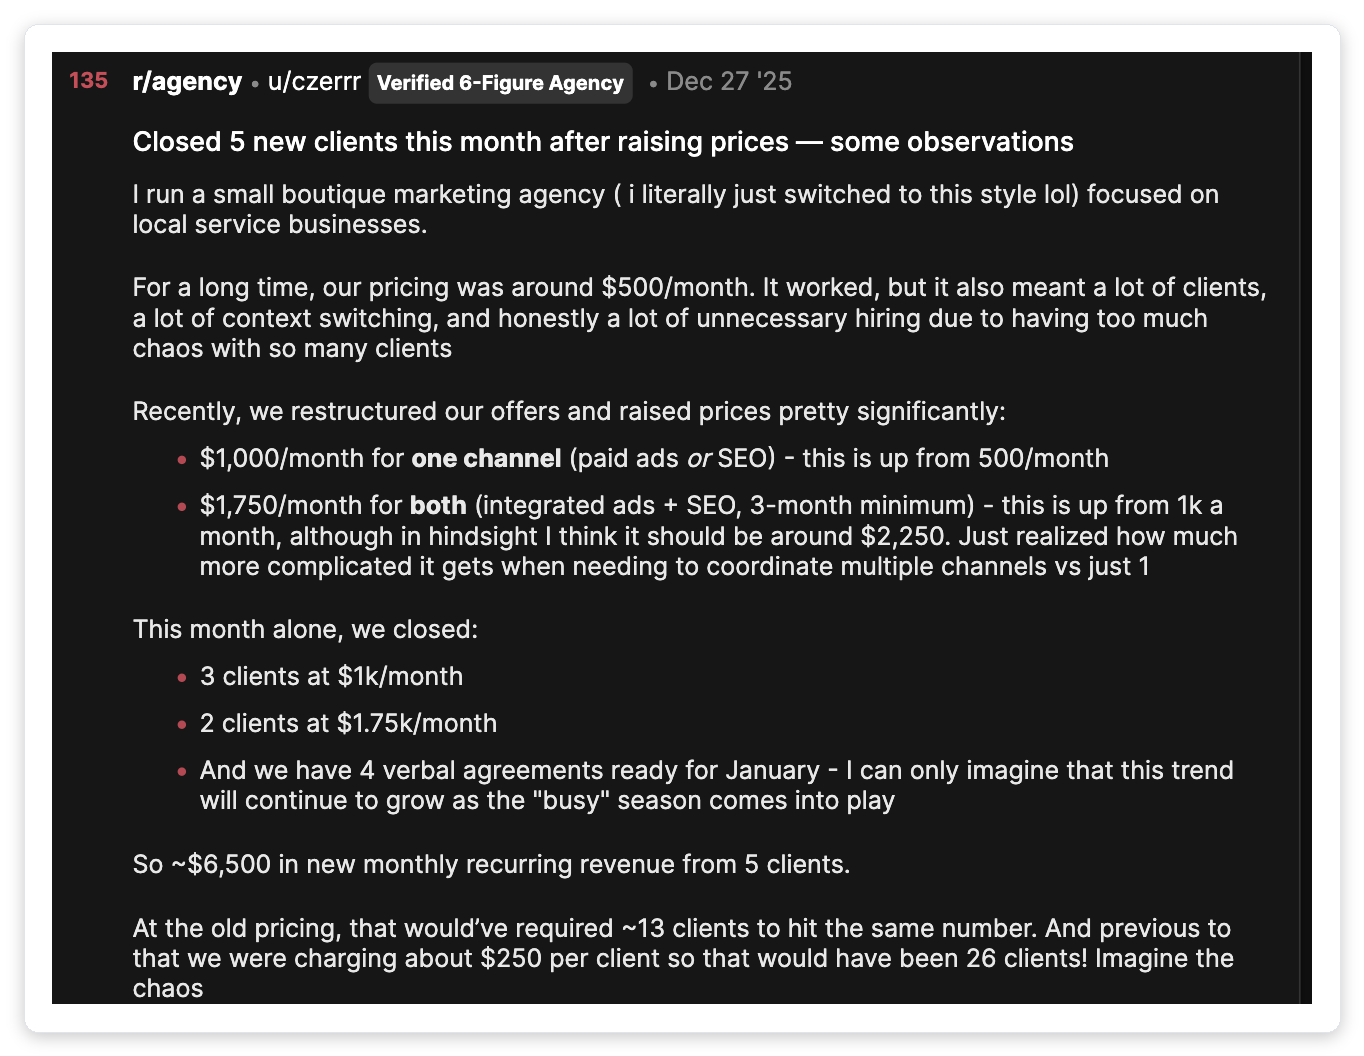
He moved from $500 a month to $1,000 for one channel and $1,750 for two, then closed five clients in the first month at the new price. His own arithmetic is the part worth keeping.
"At the old pricing, that would've required ~13 clients to hit the same number. And previous to that we were charging about $250 per client so that would have been 26 clients!"
u/czerrr · r/agency
He also reports that raising the price did not reduce demand, it changed who replied. That matches what the ratio table shows: buyers are sorting themselves by category, and the price is the category label.
The dead middle shows up in your margin, not just your close rate
Promethean Research's agency survey found the average digital agency earned a 13% after-tax net margin in 2025, down from 14% in 2024 and below the long-run average of roughly 15% since 2015.
Split that by size and the middle disappears again.
Agencies that reduced the number of services they sell averaged 30% net margins, against an industry average of 13% (Promethean Research).
Doing more things for more kinds of client is how an agency ends up quoting the median price. Narrowing is a pricing move disguised as a service-mix move.
What marketing work actually pays on Upwork right now
If your agency sells on Upwork, the benchmark that matters is not a US rate card. It is what buyers on the platform are posting.
We pulled every Sales & Marketing job posted on Upwork in July 2026 from GigRadar's market index.
| Subcategory | Jobs posted | Median posted hourly floor | Median fixed budget |
|---|---|---|---|
| Sales & Marketing (all) | 28,961 | $5.40 | $122.58 |
| Digital Marketing | 17,464 | $6.22 | $103.00 |
| Lead Generation & Telemarketing | 8,756 | $4.72 | $155.97 |
| Marketing, PR & Brand Strategy | 2,741 | $8.00 | $250.00 |
Source: GigRadar market index, Upwork job postings, 1 to 31 July 2026. Medians are estimated from the posted budget fields, and hourly maximums appear on only about half of hourly postings, so the floor is the honest number.
Sales & Marketing was 21.5% of all Upwork job postings that month, 28,961 out of 134,728. It is the largest single category on the platform and it has the lowest posted floors.
Read the last row again. The strategy subcategory posts a floor 48% higher and a median fixed budget roughly double the platform's marketing average, on one tenth of the volume.
A $6/hour posted floor and a client who has already spent five figures are frequently the same person. The posted number is an anchor, not a budget.
Never put your rate in the proposal
Across 133,872 outbound proposals sent between December 2025 and February 2026, the baseline reply rate was 7.5%. Certain money words moved it hard.
| Phrase in the proposal | n | Reply rate | vs baseline |
|---|---|---|---|
| "Discount" | 1,749 | 10.0% | +2.5pp |
| "Milestones" | 1,718 | 8.6% | +1.1pp |
| "Negotiable" | 241 | 7.1% | -0.4pp |
| A specific "$X/hr" | 800 | 6.8% | -0.7pp |
| "Starting at $X" | 263 | 6.1% | -1.4pp |
"Discount" beats the baseline because it implies the work is worth paying for and you are choosing to move. Naming your hourly rate before anyone has described the scope does the opposite.
The rate belongs in the call, not the pitch. The Win price talks lesson in GigRadar's Agency Success course walks through the exact conversions between hourly and fixed-price contracts when a client pushes back.
🎥 From GigRadar's Agency Success Course, the Win price talks lesson.
One line from that lesson is worth stealing verbatim. When a client asks for a free test task, the course teaches you to point at Upwork's rules rather than negotiate, because Upwork treats a client's request for unpaid test work as a terms of service violation.
Free for Upwork agencies
We operate a real Upwork Business Manager account. Your agency invites our BM through Upwork's official invitation flow, and proposals go out from our BM under our team's supervision, so you can test premium and productized price points across hundreds of jobs without touching your own account.
Get Your Free Agency Audit →The four pricing positions that actually convert
Every position below works. The gap between them does not.
1. Productized floor
One deliverable, one price, no discovery call. You win on speed and predictability, and your margin comes from delivering the same thing repeatedly.
Price signal: well under the client's posted budget. Fails when: scope drifts and each client gets something custom.
2. Retainer with a named outcome
A monthly fee attached to a metric the client already tracks, not to a list of deliverables. Our retainer pricing benchmarks cover the margin math on this one.
Price signal: mid-to-upper band, justified by the metric. Fails when: the metric is one you do not control.
3. Percentage of ad spend
The paid-media convention runs roughly 10 to 30% of managed spend, tiering down as budgets grow. It is the only model where your revenue rises without a new negotiation.
Price signal: scales with the client. Fails when: spend drops and your fee drops with it, so always pair it with a floor.
4. Premium specialist
You charge several times the market rate for one narrow problem, and the price itself is the proof of expertise. Narrowing to one problem is what produced the 30% margins in the Promethean data.
Price signal: 2 to 5 times the posted budget. Fails when: you cannot name the specific problem in one sentence.
How to move off the median in one quarter
Run the new-business change and the existing-book change at the same time. The book needs a full renewal cycle to move, so starting it second costs you a quarter.
Run every active client through the calculator above. Most agencies discover two or three clients paying an effective rate below their own delivery cost.
Narrowing the service list is what produced the 30% margins in the Promethean data. Choose the position, then delete the offers that contradict it.
Send nothing in the 95 to 105% band. Track reply rate by band yourself so you are measuring your own market, not ours.
Raise by enough to change the category, not by 10%. A 1.1x increase is the worst-performing ratio in our data, and it annoys the client for no positioning gain.
A price change costs you close rate before it earns you margin, so the pipeline has to grow first. Our marketing agency lead generation playbook covers the volume side.
What this means for how you quote next week
Marketing agency pricing has a comfortable answer and a correct one. The comfortable answer is to charge what the market charges, which is exactly the band where reply rates and margins are both worst.
The correct answer is to pick an edge you can defend, then price far enough from the median that the buyer has to think about you differently. Our guide to pricing proposals on Upwork and the Upwork agency pricing playbook go deeper on executing that on-platform, and the Upwork hourly rate benchmarks show where individual rates land by category.
| If your effective hourly rate is | Do this next week |
|---|---|
| Under $25 | Fix the scope before the price. Productize one deliverable so the same work is not re-quoted every time. |
| $25 to $75 | You are in the trough. Pick an edge and cut the offers that contradict it, then reprice at renewal. |
| $75 to $150 | Defend it by narrowing. Every service you add pulls you back toward the median. |
| Over $150 | Protect the pipeline. At this end, volume is the constraint, not price. |
One caveat on our own numbers. The reply rates above come from GigRadar customers' outbound proposals, not from the whole Upwork market, so they measure how agencies running structured outbound perform rather than the platform average.
The shape of the curve has held every quarter we have measured it.