
Lead Scoring Template: Why Your Best Leads Reply Worst covers the 100-point model in 2 minutes, and the back-test that inverted our own score. Watch on YouTube
TL;DR
→ We scored 59,339 Upwork opportunities with a match model, then measured what replied. The top-scoring decile came back at 5.18% against 8.19% for the bottom.
→ Every lead scoring template on the internet has two dimensions: fit and engagement. Neither one measures how many other vendors are chasing the same lead.
→ Contention is the biggest measured effect we have. Reply rate falls from 9.44% to 2.11% when eleven or more GigRadar customer agencies bid the same job.
→ The firmographic default is inverted here. Clients who have spent over $500k on Upwork reply at 3.85%, against 8.15% for clients who have spent under $1k.
→ Below: a free interactive lead scoring template (25 points fit, 40 client, 35 contention), the point values with sample sizes, and a copyable rubric for your sheet or CRM.
Two years ago we shipped a match score. It ranks every Upwork job against an agency's scanner and hands back a number between 0 and 1.
Then we joined 59,339 of those scored opportunities to what happened next. The jobs our model called a near-perfect match replied at 5.18%, and the ones it nearly rejected replied at 8.19%.
The score was not broken. It was measuring the wrong quantity: a job that looks perfect to your scoring model looks perfect to everyone else's too, and the number you built to find opportunity turned out to be a very good detector of crowding.
That is the flaw in every lead scoring template I have ever been handed, and it is why the one below spends more than a third of its points on a dimension your CRM does not have a field for.
Every lead scoring template measures two things, and neither one is competition
Open any lead scoring tool and you get the same two axes. HubSpot's own documentation is explicit about it: a fit score rates "property values" and an engagement score rates "events", and a combined score is "the total value for the engagement and fit points combined".
Fit describes the lead. Engagement describes what the lead did.
Both are properties of a single record sitting alone in your database.
Neither answers the only question that decides whether you get a reply on a marketplace: how many other agencies are working this exact lead this afternoon.
The marketplace correction
In a CRM, two salespeople scoring the same inbound form fill is a routing bug. On Upwork it is Tuesday.
The lead is public, the buyer is one inbox, and your score competes with forty other scores computed from the same visible fields.
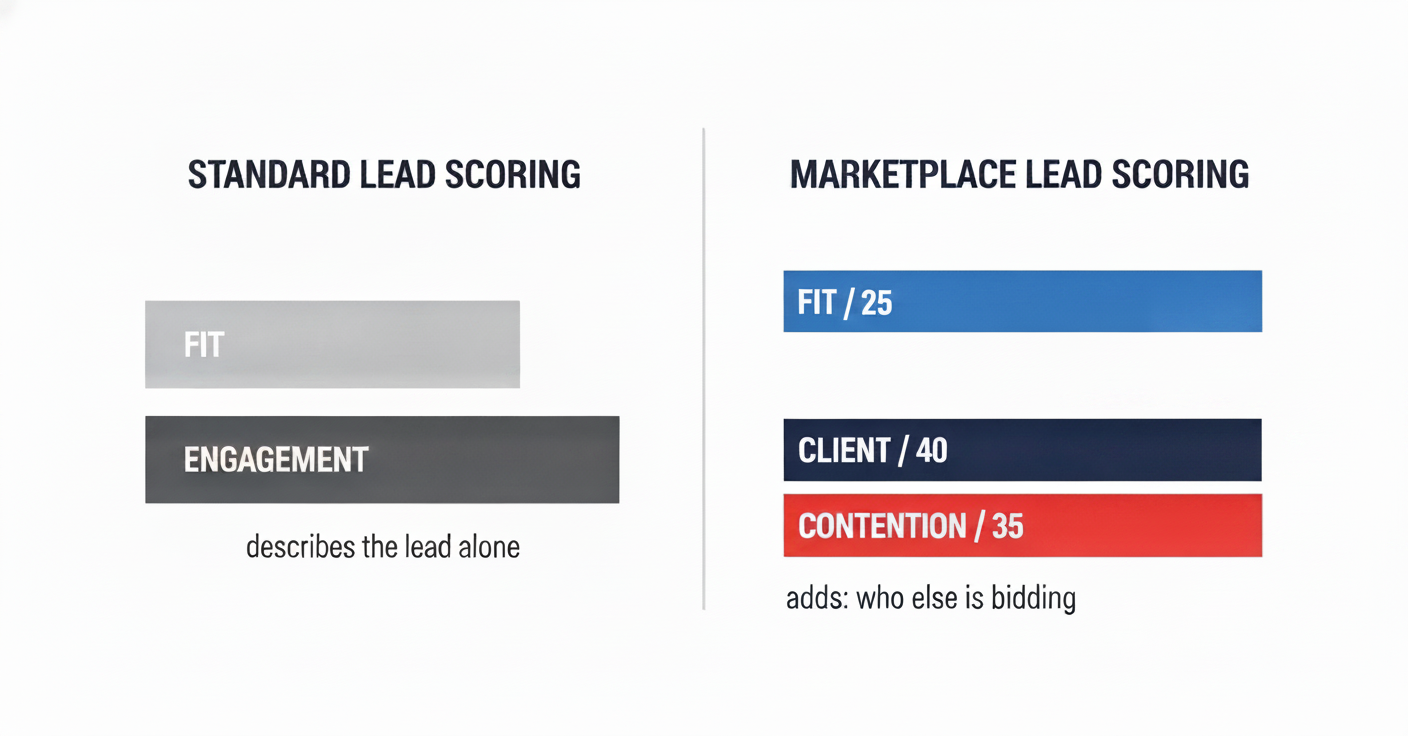
The missing third axis. Fit and engagement both describe the lead in isolation; contention describes the queue in front of it.
That difference is not cosmetic. It flips the sign on half the criteria a standard template ships with.
Upwork publishes the buyer's history on every job post under "About the client". That panel is the raw input for the fit and client blocks below.
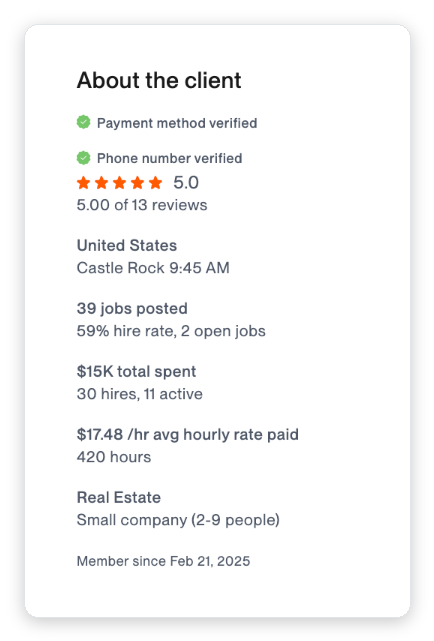
Every input in Block B is on this panel: total spent, jobs posted, hire rate, and average rate paid to past hires.
What happened when we scored 59,339 leads and then checked
Line the score deciles up against reply rate and the curve runs the wrong way.
The bottom decile beats the top decile by 58%. The relationship is noisy in the middle and unambiguous at the ends.
I want to be precise about what this does and does not prove. It does not prove your fit criteria are worthless, and it does not prove low-fit work converts to revenue better.
It proves that a fit score, on a public marketplace, is partly a measurement of how many other people can also see the opportunity.
For scale: a 30-feature model built on cover-letter and bid features reached an AUC of 0.585 and explained roughly 16% of the variance in reply outcome. That model contained no client-quality feature and no contention feature at all, which is most of what the template below scores.
So the template below is a triage tool, not an oracle. It is built to stop you spending Connects on the most contested third of your pipeline.
The lead scoring template, as a calculator
Score one live job post. The three blocks are weighted 25 fit, 40 client, 35 contention, and every point value traces back to a measured reply-rate delta in the tables further down.
Free lead scoring template
Answer nine questions about one job post. Nothing is sent anywhere.
Block A: Fit (max 25)
Block B: Client (max 40)
Block C: Contention (max 35, goes negative)
Thresholds: 65 and up means bid and consider boosting, 45 to 64 means bid without boosting, 25 to 44 means bid only with spare Connects, under 25 means skip. Derived from single-variable reply deltas, so treat it as triage rather than prediction.
Why the fit block is capped at 25 points
Standard templates give fit the majority of the weight, because in a CRM fit is the only thing you know before the lead does anything. The tooling encourages it: HubSpot lets you stretch the score range as far as -10,000 to 10,000.
That is a lot of room to express a preference you have never tested. On Upwork you also know the buyer's entire purchase history, so spending 70 points on "do they look like our ICP" wastes the better signal.
Fit still earns its 25. Category experience is real, and the job title carries surprising information: titles containing the word "urgent" reply 3.07 percentage points above baseline, while titles built on a bare role noun like "developer" run 2.70 points below it.
The one fit signal worth more than it looks is the experience-level tag, and it points the opposite way from where agencies bid.
| Experience level on the post | n | Reply rate |
|---|---|---|
| Entry level | 338 | 14.20% |
| Entry (older tag) | 593 | 9.44% |
| Expert | 63,323 | 7.78% |
| Intermediate | 69,576 | 7.10% |
Source: GigRadar internal pipeline data, Dec 2025 to Feb 2026. The entry-level cohort is under 1% of volume, so treat the 14.20% as directional.
Almost every agency filters entry-level work out on day one. That filter is why the cohort is uncrowded, and the uncrowding is most of the lift.
The client block is where the standard template is simply inverted
Generic lead scoring hands the most points to the biggest company. Enterprise headcount, big revenue band, well-known logo, plus twenty.
We have the buyer's actual lifetime spend on 91,056 proposals, which is the marketplace version of that field. It runs the other way.
| Client lifetime spend | n | Reply rate | Points |
|---|---|---|---|
| $0, new client | 25,413 | 6.89% | +7 |
| $1 to $1k | 11,506 | 8.15% | +12 |
| $1k to $5k | 13,817 | 7.90% | +12 |
| $5k to $25k | 16,908 | 6.84% | +6 |
| $25k to $100k | 12,977 | 6.03% | +2 |
| $100k to $500k | 8,070 | 5.70% | 0 |
| Over $500k | 2,365 | 3.85% | -8 |
Source: GigRadar internal pipeline data, Dec 2025 to Feb 2026. Client metadata is the job's posting-time snapshot.
The buyers who have spent over half a million dollars on the platform reply at less than half the rate of the ones who have spent under a thousand. They are professional buyers with incumbent freelancers, and a lot of their public posts are price discovery rather than hiring.
Feedback score behaves the same way, and this is the point where most people stop trusting the data.
13.11%
Reply rate on clients rated under 3.5 stars (n=351)
6.51%
Reply rate on clients rated 4.8 or higher (n=49,135)
5.83%
Reply rate on clients who have posted exactly one job before (n=10,806)
A client with poor reviews is reading every proposal, because their last hire went badly and their reputation on the platform is a problem they need solved. A client with 4.8 stars and a full roster is skimming.
This is the one criterion in the template I would tell you to override on purpose. Reply rate is not delivery risk.
Upwork's payment protection covers the money on hourly contracts. It does not cover three weeks of scope arguments.
If your agency cannot afford a difficult client, score it down and accept the lost replies. Our ICP red-flag list covers which of those clients are worth avoiding.
Duration is the last client signal, and it is bimodal. Under a month replies at 8.33% and over six months at 8.08%, while the three to six month band sits at 6.71%, which is where scope-creeping projects with no real deadline live.
Contention is the block your CRM has no field for
This is the largest effect in the entire dataset, and no lead scoring template I have seen contains it.
We can see when several of our customers bid the same Upwork job. When we bin proposals by how many agencies showed up, reply rate collapses.
To be exact about what this counts: these bins are GigRadar customer agencies, not total proposals on the job. It is a floor on real contention, because every job also carries bidders we cannot see.
Reply rate falls 4.5 times between one and eleven. And 67% of proposals in that window landed on a job where at least one other GigRadar agency was also bidding.
The damage is not evenly spread. Technical categories cannibalise hardest, because their scanner queries overlap most.
| Category | 1 agency bidding | 6 to 10 bidding | Drop |
|---|---|---|---|
| IT & Networking | 12.67% | 3.85% | -8.82pp |
| Data Science & Analytics | 9.63% | 0.99% | -8.64pp |
| Design & Creative | 8.97% | 1.69% | -7.28pp |
| Web, Mobile & SW Dev | 7.97% | 3.90% | -4.07pp |
| Sales & Marketing | 11.44% | 7.77% | -3.67pp |
Source: GigRadar internal pipeline data, Dec 2025 to Feb 2026.
A Data Science lead that six GigRadar agencies are working is worth 1% of a reply. The same lead with nobody else on it is worth nearly ten times that, and your fit score cannot tell the two apart because the job post is identical.
Freelancers have been hand-approximating this for years without a name for it. The threads are full of people refusing to bid once the proposal counter crosses a threshold, or once a client's hire rate drops below their personal cut-off.
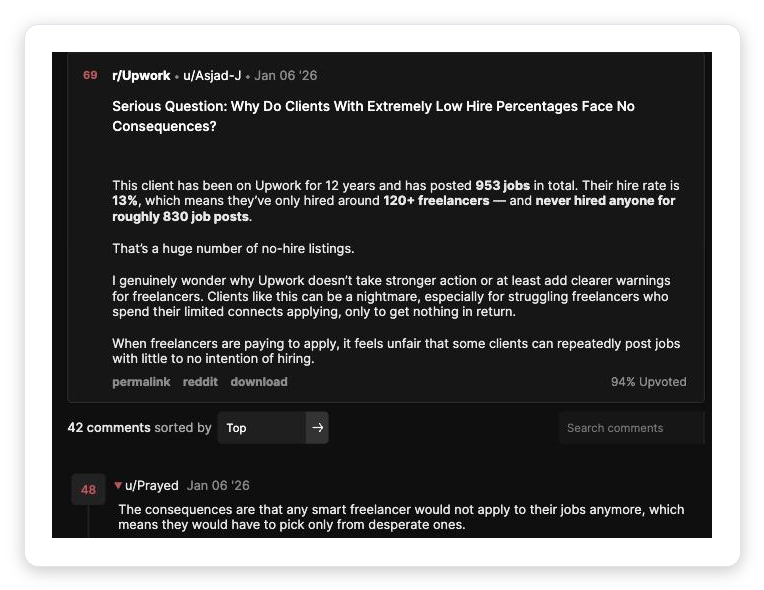
A client with 953 posts and a 13% hire rate, and the reply explaining the feedback loop. Source: r/Upwork.
Ask that subreddit what hire rate is high enough to justify applying and you get answers ranging from 50% to "nothing under 90% if you are new". Those are hand-built scoring thresholds, invented independently by people who have never used the phrase lead scoring template.
Upwork already prices contention, and the price band is a scoring signal
You do not have to guess at crowding, because Upwork sells you a reading of it. The number of Connects a job costs is set by demand: Upwork's own help page says the cost "varies per job and can change during the time the job is posted" based on "project size, scope, and market demand".
Connects cost $0.15 each, so that price is also your unit cost per scored lead. What our data shows is that the price ladder has a hole in the middle.
| Connects to apply | n | Reply rate | Points |
|---|---|---|---|
| 1 to 2 | 91,388 | 7.61% | +6 |
| 5 to 6 | 318 | 5.35% | -8 |
| 7 to 8 | 1,018 | 4.03% | -8 |
| 9 to 10 | 3,067 | 5.05% | -8 |
| 11 to 12 | 3,185 | 8.04% | +8 |
| 13 to 16 | 10,602 | 7.58% | +8 |
| 17 or more | 24,294 | 7.16% | +8 |
Source: GigRadar internal pipeline data, Dec 2025 to Feb 2026.
Cheap jobs work and expensive jobs work. The five to ten Connect band is where reply rate bottoms out at 4.03%, and it costs you three to five times what the cheap band does.
The other lever is the boost auction, a sealed-bid contest for the top four slots that Upwork describes as useful "especially when lots of freelancers are applying to the same job".
If you are bidding into that auction, the platform has already told you the lead is contested. The full economics sit in the Connects cost-per-hire calculator.
The negative block is where the real gain is
Most scoring rubrics treat negative points as an afterthought for unsubscribes and competitor domains. Here they carry the model.
The clearest one is pricing position. We have the client's average paid rate to past hires on 56,643 proposals, and the worst possible bid is the one that sits just above it.
| Your bid ÷ client's typical paid rate | n | Reply rate |
|---|---|---|
| Under 0.5x | 1,648 | 6.74% |
| 0.5x to 0.8x | 3,675 | 6.64% |
| 0.8x to 1.0x | 3,333 | 6.36% |
| 1.0x to 1.2x | 3,560 | 5.37% |
| 1.2x to 1.5x | 4,754 | 5.68% |
| 1.5x to 2x | 6,037 | 6.53% |
| 2x to 5x | 12,492 | 6.89% |
| Over 5x | 4,583 | 7.70% |
Source: GigRadar internal pipeline data, Dec 2025 to Feb 2026.
Slightly expensive is the one position with no story attached to it. Clearly cheap and clearly premium both convert better than the band that says "a bit more than you usually pay, for reasons I have not explained".
The second negative worth wiring in is your own inbox position. Being in the first five proposals replies at 7.28%, positions 6 to 10 sink to 6.03%, and positions 21 to 50 recover to 7.77%.
The second-screen trap
Clients read the first five proposals properly, skim the next fifteen, then sample randomly into the deep pile if nobody in the top twenty grabbed them. Landing at position 8 is worse than landing at position 30, so if you cannot be early, being late is safer than being nearly early.
Free for Upwork agencies
Score every job before you spend a Connect on it
GigRadar scans Upwork for the jobs that match your agency, scores them on client quality and contention, and submits proposals through our own Upwork Business Manager account under human supervision. Your freelancer account is never touched.
Get Your Free Agency Audit →The full rubric, ready to paste into a sheet
Here is the whole lead scoring template as text. Paste it into a spreadsheet column, or translate each line into a scoring rule in your CRM.
The worksheet version
If you would rather score in a sheet than in the widget, this is the same model as a grid. Copy it straight into Google Sheets or Excel with the button, then fill the last column per lead.
| Block | Criterion | Scale | Max | Your score |
|---|---|---|---|---|
| A. Fit | Category you have been hired in | exact +10 / adjacent +5 / new 0 | 10 | |
| A. Fit | Job title language | "urgent" +7 / outcome +3 / neutral 0 / role noun -5 | 7 | |
| A. Fit | Experience level tag | entry +8 / expert +4 / intermediate +2 | 8 | |
| B. Client | Lifetime spend on Upwork | $1-5k +12 / new +7 / $5-25k +6 / $25-100k +2 / $500k+ -8 | 12 | |
| B. Client | Feedback score | <4.0 +10 / 4.0-4.5 +6 / 4.5-4.8 +4 / none +3 / 4.8+ 0 | 10 | |
| B. Client | Jobs posted before | 6-25 +8 / none +6 / 2-5 +4 / 50+ +4 / 26-50 +3 / exactly one -6 | 8 | |
| B. Client | Stated duration | <1mo +10 / >6mo +9 / 1-3mo +3 / 3-6mo -4 | 10 | |
| C. Contention | Your position in the pile | 21-50th +10 / 1-5th +8 / 51st+ +8 / 11-20th -4 / 6-10th -8 | 10 | |
| C. Contention | Your scanner's own match score | loose +10 / middling +4 / near-perfect -8 | 10 | |
| C. Contention | Connects charged to apply | 11+ +8 / 1-2 +6 / 5-10 -8 | 8 | |
| C. Contention | Bid vs client's typical paid rate | >5x or <0.8x +7 / 1.5-2x +3 / 1.0-1.2x -7 | 7 | |
| Total | Threshold | 65+ bid and boost / 45-64 bid / 25-44 spare only / <25 skip | 100 |
How to run this without turning it into a spreadsheet ritual
A scoring model that nobody maintains decays into superstition within a quarter. Five steps, and the last one is the only one people skip.
Score 50 jobs you already bid on, blind to the outcome
Use last quarter's proposals. You need the score and the result in the same sheet before you trust a single threshold.
Move your own thresholds, not the point values
The point values come from a large sample. Your cut-off is the part that should be yours, and it depends on how many Connects you can afford to lose per week.
Wire the contention block into your scanner, not your proposal step
Where you would land in the pile and the Connect price are both visible before you write anything. Scoring after the cover letter is written wastes the only cost the model was built to save, and Boolean operators in Upwork's advanced search are what let you build a query nobody else is running.
Track cost per reply by score band, not overall reply rate
Cost per reply spans 2.4 times across categories in our data, from $14.30 in Writing to $34.21 in Web, Mobile and Software Development. A blended number hides which band is burning your budget.
Recalibrate on a 90-day clock
Reply rates take 75 to 90 days to fully cure, so a 30-day read on a new threshold is mostly noise. Put the review in the calendar or it will not happen.
The scanner point matters more than it sounds. If your queries surface the same jobs every other agency's queries surface, you are paying full price for the most contested third of the market, which is the failure mode our 60-second job qualification guide was written to catch by hand.
Everything upstream of this template is targeting. If your ICP template and your scanner disagree, the score will faithfully rank leads you should never have surfaced, and the MQL to SQL handoff will inherit the error.
What this template deliberately does not do
It scores the client, not you. Your own Job Success Score is the other half of whether a contested lead is winnable, and no rubric you build about the buyer will fix a profile that clients bounce off.
It also scores replies, not revenue. Reply rate is our north-star because hires under-count badly when customers close off-platform, but the two come apart in specific places.
| What the score optimises | What it will not tell you |
|---|---|
| Whether a client opens a conversation | Whether that client pays on time |
| Which leads are cheapest to reach | Which leads have the largest contract value |
| Where your Connects are being wasted | Whether your cover letter is any good |
| Crowding at the moment you scored | Crowding four hours later |
The last row is the real limitation. Contention is a live quantity, and a score computed at 9am on a job that goes viral by lunchtime is stale by the time your proposal lands.
That is the part a spreadsheet cannot fix, and it is the honest reason we built the scoring into the scanner rather than shipping you a better sheet. If you want the same logic running continuously against every new Upwork post in your niche, GigRadar's scoring system is that idea productised, and our response-rate benchmarks give you the numbers to check it against.
Lead scoring template FAQ
What should a lead scoring template include?
Three blocks rather than the usual two: fit (capped, because on a public marketplace a high fit score doubles as a crowding warning), client quality read from the buyer's visible purchase history, and contention, meaning how many other vendors are working the same lead. Contention carries the largest measured effect in our pipeline data, with reply rate falling from 9.44% to 2.11% between one GigRadar customer agency bidding a job and eleven of them.
What point values should I assign in a lead scoring model?
Assign them from measured outcome deltas rather than intuition: the template above weights 25 points to fit, 40 to client quality and 35 to contention, and every line traces to a reply-rate difference with its sample size published. If you have your own outcome data, score 50 past leads blind and let your own deltas set the weights.
What is a good lead score threshold?
We use 65 and above for bid-and-boost, 45 to 64 for bid without boosting, 25 to 44 for spare capacity only, and skip below 25. Move the threshold rather than the point values, because the right cut-off depends entirely on how many Connects you can afford to lose per week.
Why do my highest-scoring leads convert worst?
Because on a marketplace, the criteria that make a lead look attractive to you make it look attractive to everyone else running a similar model. Across 59,339 scored opportunities our top match-score decile replied at 5.18% against 8.19% for the bottom decile, and reply rate falls from 9.44% to 2.11% between one GigRadar customer agency on a job and eleven of them, which is the signature of crowding rather than a broken score.
Should big clients score higher in a lead scoring template?
Not on Upwork, where the generic firmographic rule that awards points for company size is inverted. Buyers with over $500k of lifetime platform spend replied at 3.85% against 8.15% for buyers who had spent under $1k, because the large accounts already have incumbent freelancers and treat the public bid pool as price discovery.
How often should I recalibrate a lead scoring model?
Every 90 days. Reply data needs 75 to 90 days to fully cure in our windows, so judging a new threshold after 30 days mostly measures noise, and leaving it untouched for a year means scoring against a market that has moved.