
SaaS Valuation Calculator: Why It's 3.8x, Not 10x (2026) The 2026 multiples in under two minutes, and what actually moves yours. Watch on YouTube
TL;DR
- The median public SaaS company traded at 3.8x revenue on 31 July 2026, down from 7.0x at the end of 2024 and roughly 17x in 2021. Any SaaS valuation calculator handing you 8x is quoting a dead market.
- Median disclosed SaaS M&A revenue multiple was 3.1x as of March 2026, and deals under $5M in size clear around 3.3x.
- Your revenue size sets the band. Retention, client concentration and owner dependence decide where in it you land, and stacked together they swing the answer by roughly 80%.
- Being the only person who can sell costs an agency 15% to 30% of its valuation. That is a sales-process problem, not a finance problem.
- The calculator below runs both models: ARR multiples for SaaS, adjusted EBITDA multiples for agencies and services firms. Every coefficient is sourced and shown.
On 31 July 2026 the median company in the SaaS Capital Index traded at 3.8 times revenue. In late 2021 that same median was near 17x.
Almost every SaaS valuation calculator I have opened this year still runs 2021 math. Feed one $1M in ARR and it returns $8M, which is somewhere between two and three times what a real buyer would actually wire.
I run an Upwork lead-gen company and I talk to agency owners every week who are quietly planning an exit. The number in their head almost always comes from a free calculator, and it is almost always wrong in the same direction.
So I built one that is honest about 2026, and that asks the questions buyers actually ask.
The multiple everyone quotes is three years out of date
Public SaaS is the reference price for every private deal below it. When the index re-rates, private offers follow.
Private M&A did not fall in a straight line. Aventis Advisors records a median of 2.9x in 2024, a recovery to 3.8x in 2025, then 3.1x as of March 2026.
The public collapse is monotonic, the deal market bounced. Anyone showing you only the down years is selling something.
SaaS Capital opened 2025 by writing that the index median stood at 7.0 times current run-rate annualized revenue. Eighteen months later the same index reads 3.8x.
Their own commentary on the first quarter of 2026 is blunt about why. The ARR multiple "now sits at decade-plus lows" as public markets priced AI in as a real threat to seat-based software.
Private multiples are not public multiples. SaaS Capital models bootstrapped private SaaS at 4.8x and equity-backed at 5.3x, above the public median, because private deals are priced on quality rather than daily sentiment.
Those two are modelled on end-2024 data, so treat them as a ceiling rather than today's price. Both still sit far below the 8x to 12x that most free calculators assume.
What that looks like at the small end is worth seeing in the wild. A two-person bootstrapped SaaS at roughly $350K ARR posted the indicative offer it received: about $1M, cash plus a twelve-month earnout.
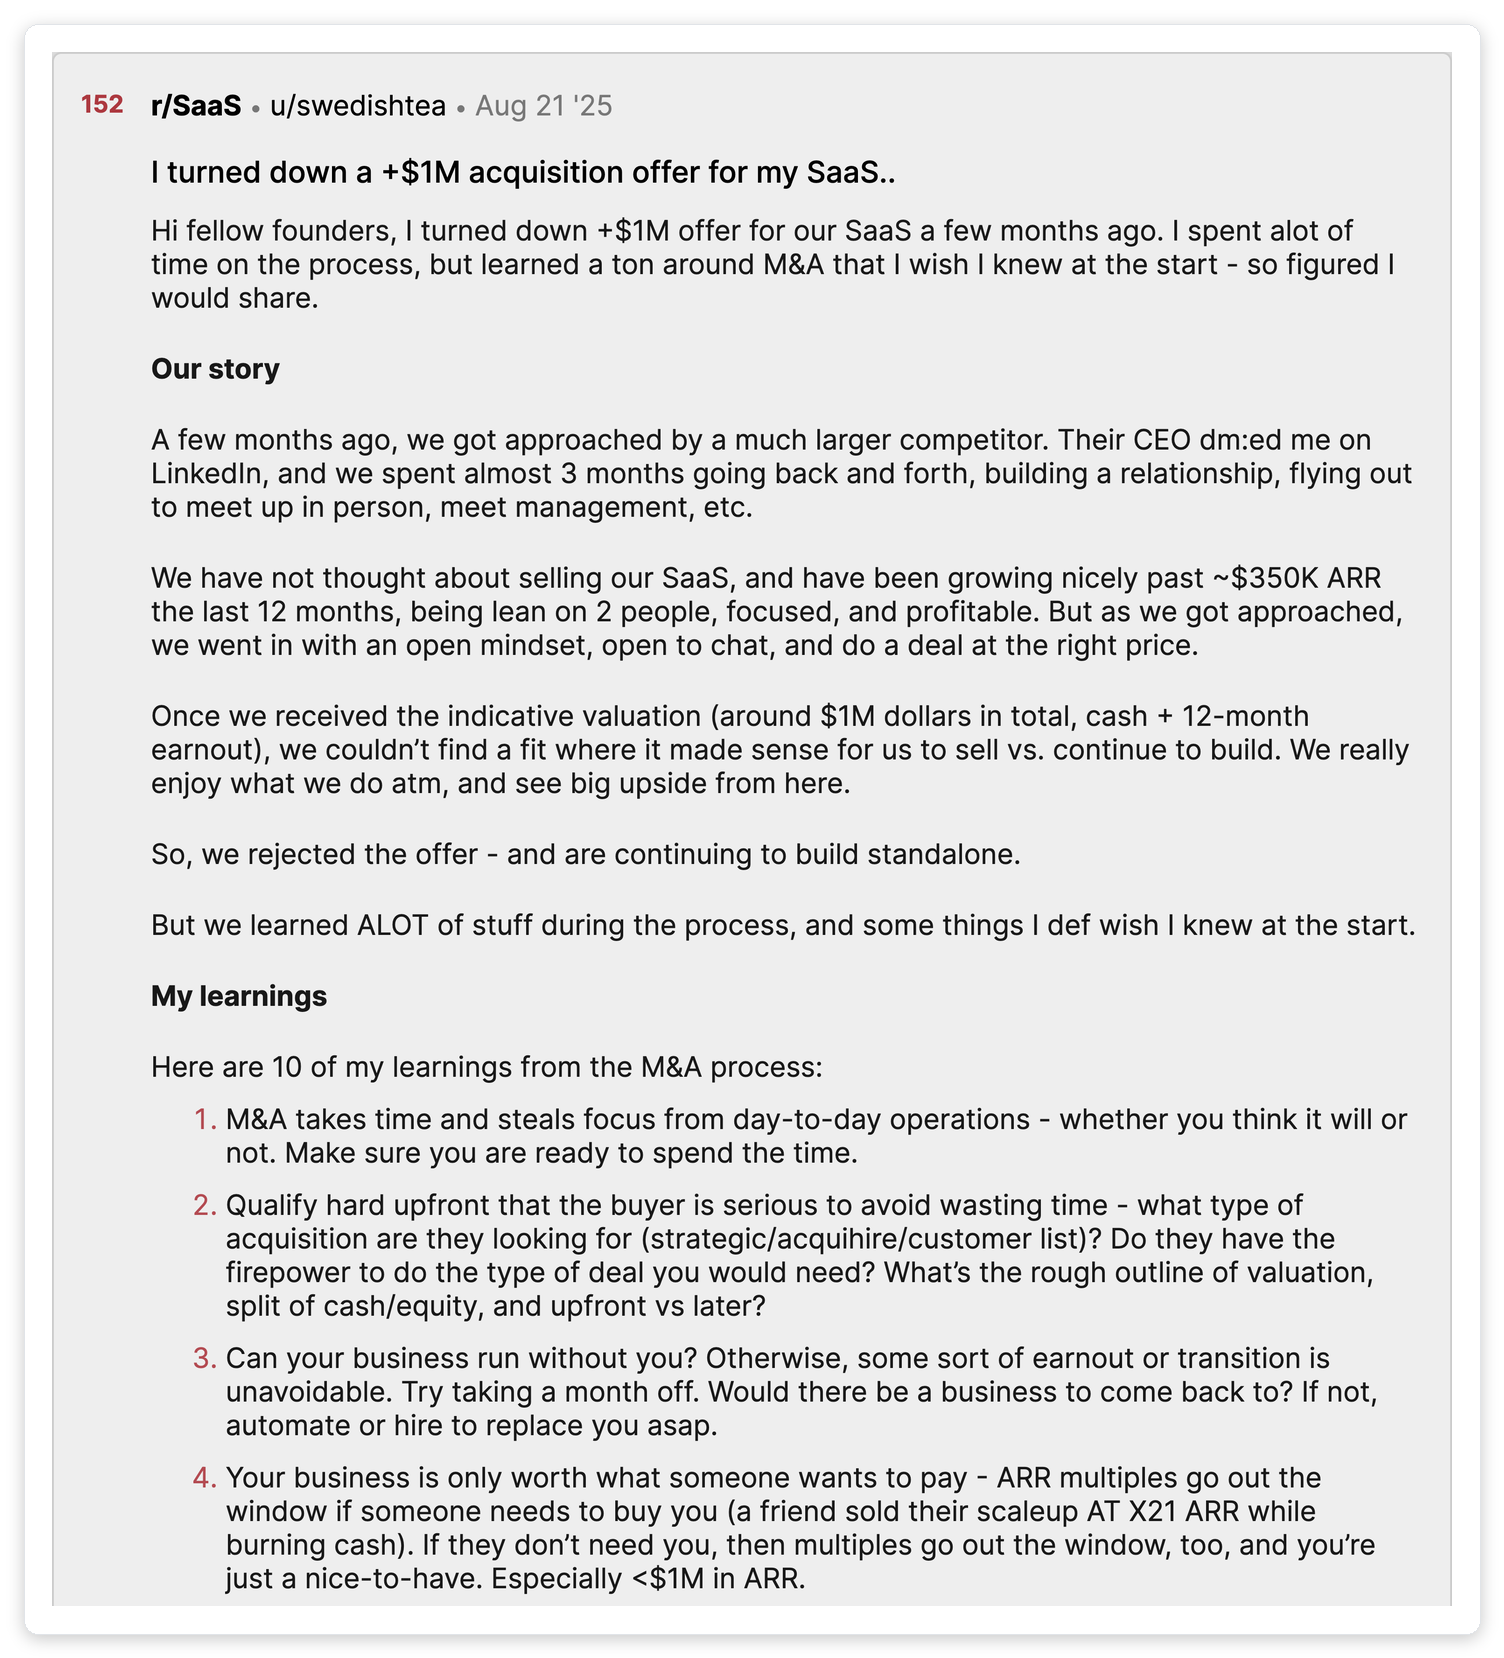
That is 2.9x ARR, from a real buyer, on a profitable and growing business. Small deals clear below the headline median, and the sub-$5M band runs around 3.3x, so 2.9x on $350K of ARR is close to exactly where the data says it should land.
It is also nowhere near the 8x a free calculator would have told him to hold out for.
His third lesson from the process is the one I would tattoo on every founder. Can the business run without you, because otherwise an earnout is unavoidable.
Run your own number: the 2026 SaaS valuation calculator
Two modes, because most of the people reading this do not run pure SaaS. The agency mode prices on adjusted EBITDA, which is what buyers of services businesses actually underwrite.
Interactive Tool
What is your business actually worth in 2026?
Built on published 2026 multiples, not 2021 nostalgia. Nothing you type leaves your browser.
Adjusted EBITDA means after add-backs: owner compensation above market rate, personal vehicles and travel, and genuine one-offs like a legal settlement. Anything recurring that the business actually needs is not an add-back.
Below $500K of earnings, buyers usually price on SDE, which is earnings before your own salary.
Base multiples come from published 2026 deal data (sources listed under the table below). This is an estimate for planning, not an appraisal, and a real buyer will underwrite your churn cohort and contracts before naming a price.
Your revenue sets the band. Your replaceability sets where in it you land
Size is a real driver and I am not going to pretend otherwise. The same Aventis dataset shows deals under $5M clearing about 3.3x while $50M to $100M deals clear about 6.2x.
What you control is the spread inside your band, and that spread is enormous. Across 543 disclosed SaaS transactions since 2015 the first quartile sat at 2.4x and the third quartile at 8.1x, against a long-run median of 4.5x.
The finding that shows up most consistently in agency M&A is not about growth or margin. It is about whether the business survives the founder walking out.
FE International puts the discount for high owner dependency at 15% to 30% when the founder is the primary rainmaker or client contact. On the same data, a real leadership bench is worth a premium of 0.5x to 1.5x EBITDA.
On a $600K EBITDA agency that premium alone is $300K to $900K. The owner-dependency discount sits on the other side of it, which is how two agencies with the same profit end up a long way apart.
FE International is a brokerage, so read its published bands with the incentive in mind. The concentration and owner-dependency findings are standard M&A practice and corroborated across advisers, which is why I use them here rather than the headline multiples.
Operators report lower numbers than brokers publish, and you should plan against the operator numbers. In one r/agency thread an owner asked what his copywriting agency was worth and got the unvarnished version.
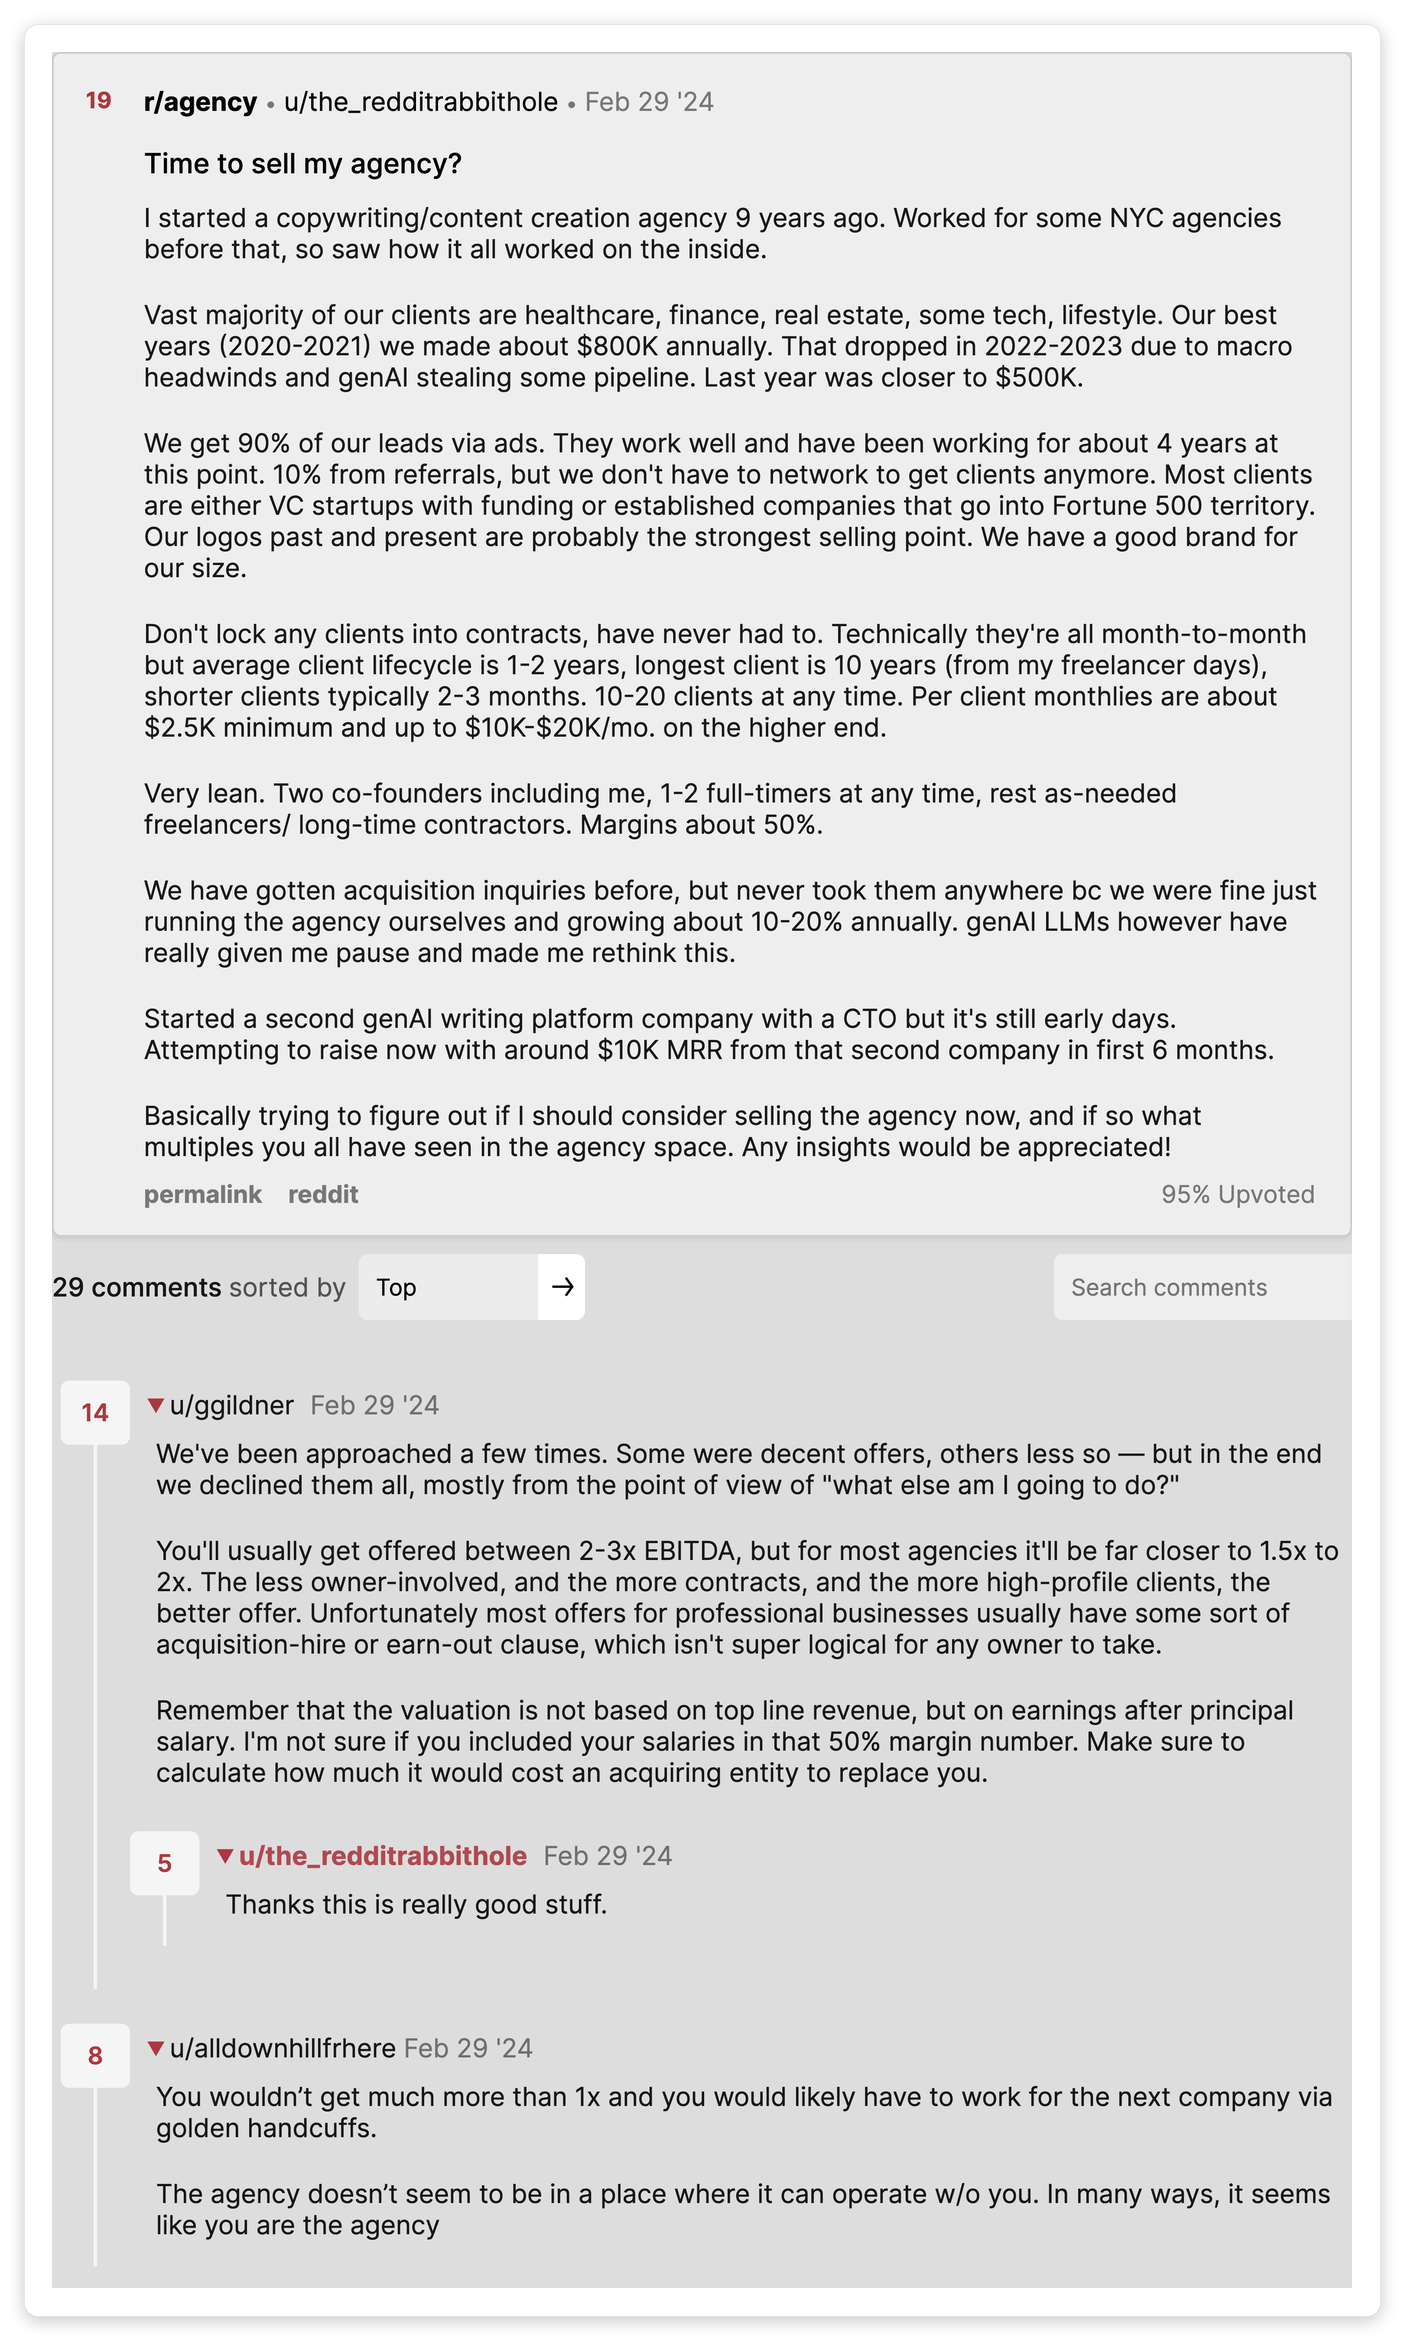
The calculator above starts from the published broker bands, so read its output as the optimistic end. Treat 1.5x to 2x EBITDA as your floor until a buyer says otherwise.
Two things in that thread matter more than the multiple. The first is that valuation runs on earnings after a market-rate salary for you, not on top-line revenue, so an owner paying himself nothing has a smaller business than he thinks.
The second is another commenter in the same thread, who put the whole article in one line. The agency does not look like it can operate without him, so in many ways he is the agency.
Client concentration works the same way and buyers are specific about the thresholds. They want no single client above 10% of revenue and the top three combined below 25%.
Cross 20% with one client and you have hit what FE calls the most reliable multiple compressor in agency deals. Sit at 30% to 40% and the discount runs 1.5x to 2x off the band, usually with more of the price pushed into an earnout.
What actually moves the number, ranked by how much it moves
These four inputs explain most of the spread between two businesses with identical revenue. They are ordered by the size of the swing, largest first.
Software above 120% net revenue retention trades at a 63% premium to the market median. Crossing from 105% to 110% NRR alone frequently adds 0.5x to 1x ARR to buyer offers.
One client above 20% of revenue compresses the multiple harder than a bad growth year. The fix takes two or three quarters of deliberate pipeline work, which is why it has to start before you talk to buyers.
Delivery being systematised is table stakes. Buyers discount hardest when acquisition lives in the founder's head, because that is the part they cannot replace with a hire in month one.
Ranked last on purpose. Growth is real but it is the input you control least in any 12-month window, and the 2026 market is paying for the profitable version of it.
Net revenue retention deserves the top slot because it is the one metric that compounds without you selling anything new. If you have not benchmarked yours, our breakdown of how to calculate and improve net revenue retention has the formula and the segment medians.
Median NRR for bootstrapped companies at $3M to $20M ARR is 104%, with the 90th percentile at 118%. By segment, SMB sits at 97%, mid-market at 108% and enterprise at 118%, per FE International (April 2026).
The Rule of 40 is a real signal, and almost nobody clears it
Aventis Advisors ran the numbers on 55 publicly listed SaaS companies on 5 May 2026. Only 8 of 55, or 15%, cleared the Rule of 40 on an EBITDA basis.
The median score was 22.6% on EBITDA and 39.1% on free cash flow. If your calculator assumes you need to clear 40 to be normal, it is grading you against a cohort that mostly does not.
The link to price is close to linear, which is why the calculator above uses it directly. Each additional 10 percentage points of Rule of 40 on a free-cash-flow basis is associated with roughly +1.0x on the EV/Revenue multiple.
The gap between passing and failing is the part worth internalising. Companies clearing 40 on FCF trade at a median 4.8x revenue against 2.7x for those that fail, which Aventis puts at a 74% premium.
Rule of 40 is measured on EBITDA or free cash flow. Several calculators quietly run it on gross margin instead, which is a far larger number and will tell a 2.7x business it is a 4.8x business.
The calculator above asks for free cash flow margin for exactly this reason.
If you are short of 40, close the gap from the margin side first. Margin is a decision you make this quarter, while growth needs four quarters and a working channel.
At a 3.1x median, a dollar of acquisition spend that buys a dollar of new revenue is roughly value-neutral before you count churn. Unprofitable growth destroys the multiple it was meant to raise.
Here is what the whole market looks like in one table, so you can find your own line before you run the numbers.
| What you are pricing | 2026 benchmark | Source and date |
|---|---|---|
| Public SaaS, median | 3.8x run-rate revenue | SaaS Capital Index, 31 Jul 2026 |
| Private SaaS, bootstrapped | 4.8x ARR | SaaS Capital model, Jan 2025 |
| Private SaaS, equity-backed | 5.3x ARR | SaaS Capital model, Jan 2025 |
| SaaS M&A, all disclosed deals | 3.1x revenue | Aventis Advisors, Mar 2026 |
| SaaS M&A, deals under $5M | ~3.3x revenue | Aventis Advisors, Mar 2026 |
| SaaS M&A, deals at $50M to $100M | ~6.2x revenue | Aventis Advisors, Mar 2026 |
| Agency, under $500K EBITDA | 2.5x to 4x adj. EBITDA | FE International, May 2026 |
| Agency, $500K to $1M EBITDA | 3x to 5x adj. EBITDA | FE International, May 2026 |
| Agency, $1M to $2.5M EBITDA | 4x to 6.5x adj. EBITDA | FE International, May 2026 |
| Agency, $2.5M to $5M EBITDA | 5.5x to 8.5x adj. EBITDA | FE International, May 2026 |
| Agency, above $5M EBITDA | 7x to 12x adj. EBITDA | FE International, May 2026 |
The agency bands above are the calculator's starting point before adjustments. The SaaS side interpolates by ARR band from the deal-size medians, so a sub-$1M-ARR business starts at 2.9x and a $1M to $5M business at 3.3x.
At the smallest tier buyers usually price on seller's discretionary earnings, which is earnings before your own salary, rather than EBITDA. If you pay yourself a market wage, your SDE is the larger number and that is what the band applies to.
Add-backs that survive diligence are the obvious ones: owner compensation above market rate, personal vehicles and travel, and genuine one-offs like a legal settlement. Anything recurring that the business actually needs is not an add-back, however much you want it to be.
Why an agency at the same revenue is worth less, and what closes the gap
A $2M-revenue agency at a 20% margin has $400K of EBITDA and starts in the 2.5x to 4x band, so $1M to $1.6M of enterprise value. A $2M-ARR software business starts at 3.3x revenue, or $6.6M.
The gap is not snobbery about services. It is that software revenue renews by default and agency revenue renews by decision.
Now put the typical agency profile through the calculator above: 45% retainers, one client at 28% of revenue, founder closes everything. The same $400K of EBITDA comes out near $500K, about half the bottom of its own band.
That is not the market being unfair to agencies. Those three inputs are the ones a buyer treats as risk, and all three are yours to change.
Which is why the retainer number matters so much. An agency above a 70% retainer mix commands a multiple 1.0x to 2.0x higher than an otherwise identical project shop, and recurring revenue lifts valuation 25% to 40% overall.
The second lever is the one most owners never treat as a valuation issue at all. If every new client arrives because you personally wrote the proposal, your acquisition is a person rather than a process.
A buyer sees that immediately. They will price it as risk, and they will be right to.
Making your pipeline boring is a valuation exercise
When we onboard an agency at GigRadar, the first thing we look at is who touches a deal between the job posting and the signed contract. In most agencies under $3M the honest answer is the founder, at every step.
GigRadar operates a real Upwork Business Manager account. Your agency invites our BM through Upwork's official invitation system, the same role you would use to onboard a hired bidder, and proposals submit from our BM under our team's supervision.
Your freelancer account is never touched. If Upwork reviews a submission, the review lands on our BM profile rather than yours.
The point for this article is narrower than the product pitch. Once outbound runs on a documented ICP, a scoring filter and a reviewed proposal process, the answer to "what happens to new business if the founder leaves" stops being "it stops".
That is the difference between the 15% to 30% owner-dependency discount and the 0.5x to 1.5x leadership-bench premium. It is also the cheapest multiple you will ever buy, because you are not adding revenue, you are removing a risk that a buyer has already priced.
There is a second document that comes out of running acquisition as a system, and buyers ask for it directly. It is cost per acquired client, broken out by channel, with the lifetime value sitting next to it.
Most agencies cannot produce that table at all. Of the ones we onboard who can, Upwork is usually the cheapest channel they run, which turns "how does new business get made here" from a story about the founder into a number a buyer can underwrite.
The same work fixes concentration. Agencies that consistently diversify away from one anchor client do it with a channel that produces new conversations every week, which is the practical argument in our piece on building a repeatable agency client acquisition system.
Free for Upwork agencies
Take yourself off the critical path
We run outbound on Upwork through our own Business Manager account, so new business keeps arriving whether or not you are the one writing proposals. That is the founder-dependency discount, removed.
Get Your Free Agency Audit →The 90-day version of this, if you plan to sell within two years
Nothing here requires a corporate development team. It requires deciding that valuation inputs are operating metrics.
Net revenue retention or retainer share, top-client concentration, and the share of last year's closed deals you personally sourced. Most owners have never written that third number down.
If one client is above 25% of revenue, the target is not to lose them. It is to add enough new revenue that their share drops below 20% within two quarters.
Document the ICP, the qualifying filter and the proposal review, then hand the whole loop to a system or a person. One clean month is the evidence a buyer wants.
Run the calculator again at day 90 with the new numbers. The revenue line will barely have moved and the valuation range usually will.
If you want the inputs to that exercise in one place, our ARR calculator, CAC calculator and customer lifetime value calculator cover the metrics a buyer will ask you to evidence. For the growth-efficiency question specifically, the SaaS magic number is the one most founders get asked about second.
What I would tell a founder staring at a 2021 number
The multiple is not coming back this year. Planning an exit at 8x revenue in a 3.1x market is how deals die in diligence, six months and a lot of legal fees later.
The number you can move is the spread around the median, and that spread is wide. Stack a weak retainer mix, one client at 30% and a founder who closes everything, and the calculator puts you roughly 80% below the same business with those three fixed.
Those three are operating decisions you can start changing this quarter. The multiple is a market condition you cannot.
Write those three numbers down before you write anything else. They are the whole valuation conversation.