
SaaS Magic Number: The 2026 Guide
🎬 SaaS Magic Number in 2 minutes: the formula, the x4 mistake, 2026 benchmarks, and how it maps to your agency channel. Watch on YouTube
The Short Version
- The SaaS Magic Number is one ratio: the new recurring revenue you added, divided by what you spent on Sales & Marketing to get it. Below 0.75 means stop scaling; above it means you have earned the right to spend more.
- The ×4 annualization everyone copies belongs to the GAAP-revenue formula, not the ARR one. Multiply net-new ARR by four and you get a fake "3.0" that flatters you into over-hiring.
- 2026 private-SaaS medians sit at 0.7–0.9 (Scale Venture Partners ~0.70; Orb 0.80 at $1–5M ARR, 0.89 at $5–20M). Anything above 1.5 usually means you are under-investing.
- The number is a correlation, not a lever. It ignores gross margin and churn, and it breaks for product-led growth. Read it next to CAC payback and net revenue retention or it will lie to you.
- Your agency's new-business channels have a magic number too. New recurring client revenue ÷ what you burned to win it is the same math, and it is where most Upwork agencies quietly run below 0.5.
Across more than 1,000 growth-stage software companies, the median Magic Number is about 0.70. That means the typical SaaS business gets back 70 cents of new annual recurring revenue for every dollar it pours into Sales & Marketing, and boards still call that "healthy."
So the metric was never about hitting some heroic ratio. It is a permission slip. Below roughly 0.75, more Sales & Marketing spend just lights money on faster. Above it, you have proof the engine converts, and you are allowed to feed it.
The problem is that almost everyone computes it wrong, benchmarks it against the wrong number, and then makes a hiring decision on the output. This guide fixes all three. Start with your own number.
Free Calculator
SaaS Magic Number Calculator
Two correct formulas, one place. Pick the inputs you actually have.
No ×4 here. Net-new ARR is already an annual figure: annualizing it again is the classic over-count.
Bands: <0.50 inefficient · 0.50–0.75 borderline · 0.75–1.0 healthy · 1.0–1.5 strong · >1.5 likely under-invested. Read alongside gross margin, CAC payback and NRR.
Whatever number you just got, hold it loosely until you know which of the three formulas produced it. They do not agree, and the gap between them is where boardroom arguments start.
The formula nobody actually agrees on
Every source defines the Magic Number as "new revenue over Sales & Marketing spend." Then they quietly disagree on all three words. Here is the honest map.
| Variant | Numerator | ×4? | Used by |
|---|---|---|---|
| GAAP | (Revthis Q − Revlast Q) | Yes | Public-market analysts, Scale VP, David Skok |
| ARR, net | New + Expansion − Churn | No | Operators, KeyBanc/Sapphire, ScaleXP |
| ARR, gross | New + Expansion | No | Early-stage boards, top-of-funnel reads |
The ×4 exists for one reason: GAAP revenue in a single quarter is roughly a quarter of your annual run-rate, so you multiply the quarterly change by four to talk in annual terms. That logic does not transfer.
Net-new ARR is already an annual number. It is the yearly contract value you added this quarter. Multiply it by four and you have annualized an annual figure, which is how Orb's own worked example lands on a Magic Number of 3.0 that even they flag as "inflated by annualization."
A founder computes net-new ARR × 4, sees 2.8, and green-lights three account executives. The real number was 0.7. Six months later the pipeline never showed up, and the burn did. If your numerator is ARR, drop the four.
The definition of "net" matters just as much. Net-new ARR subtracts churn and contraction from new and expansion revenue. The gross variant ignores the drag entirely. Both are legitimate, but a healthy gross number sitting on top of ugly churn is a trap, and only the net figure exposes it. If you want the numerator components clean, build your ARR bridge first before you compute a single ratio.
Where 0.75 came from: a VC yelling "it's magic"
The thresholds are not from a model. They are from one investor watching one company in the mid-2000s.
Rory O'Driscoll at Scale Venture Partners was analyzing Omniture, a web-analytics company run by Josh James. He noticed it generated more than $2 of first-year revenue for every $1 of go-to-market spend, and reportedly said "it's magic." The name stuck. (Scale later wrote up the whole story in a history of the Magic Number.)
"Below roughly 0.75, step back and look at the business. Above it, you are primed to leverage spend into growth. And if it is above 1.5, call me immediately."
Paraphrasing the Lars Leckie thresholds that became SaaS folklore
That is the entire origin of the "rules" your board quotes at you. A back-of-the-envelope heuristic from Hummer Winblad investor Lars Leckie, codified after the fact by Scale, David Skok's ForEntrepreneurs framework, and the Corporate Finance Institute. It is useful. It is not physics.
How to read your number: the four bands
Here is the interpretation everyone anchors on, with the nuance that the folklore leaves out. This is your first-pass read, before you layer in margin and churn.
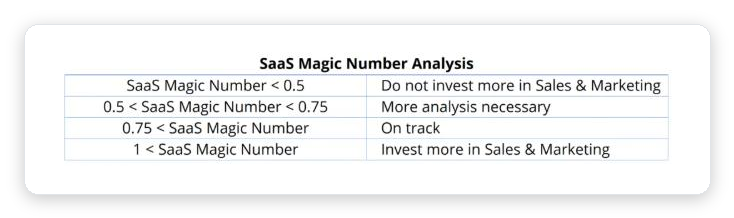
The counterintuitive part is the top band. A very high Magic Number feels like a win, but it usually means you are being too cautious with go-to-market and a competitor is happily out-spending you into your accounts.
The 2026 benchmarks: what "good" actually looks like now
The bands are timeless. The bar for "good" is not. In the 2023–2025 shift from growth-at-all-costs to efficient growth, boards started expecting the number to hold higher.
Efficiency rises modestly as you scale, as the go-to-market motion tightens and the brand starts doing free work. The Scale Venture Partners primer also found an inverse relationship worth knowing: when public valuations are rich, private medians fall (companies spend harder for growth); when capital tightens, the medians climb.
Founders debate these numbers constantly, and the debate is usually about definitions rather than performance. This exchange from the operator community is the whole argument in miniature:
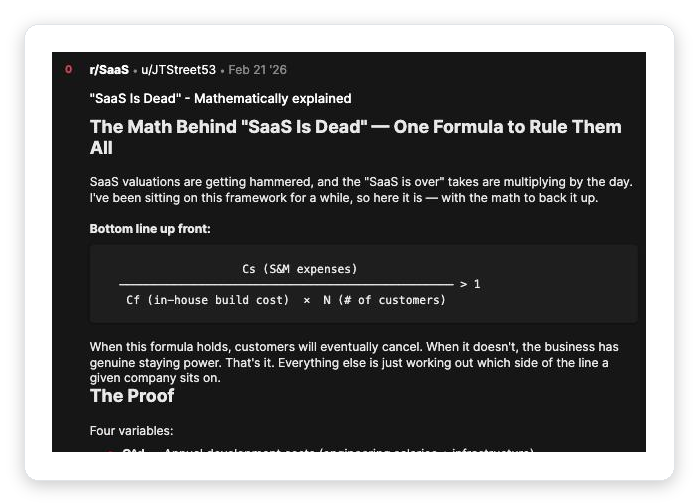
Why your magic number is probably lying to you
The Magic Number is a summary statistic wearing a causal-metric costume. Treat it as a lever and you will make expensive mistakes. Four flaws matter most.
A 0.9 on 45% margins is worse than a 0.7 on 85% margins. The metric treats a dollar of low-margin, human-delivered revenue exactly like a dollar of pure software. It should not.
High new-logo growth with brutal churn can produce the same number as steady growth with strong retention. The ratio cannot tell you which company you are.
As the essay "There's Nothing Magical About the Magic Number" argues, companies raise spend because revenue is already growing. Attributing all net-new ARR to Sales & Marketing over-credits the spend.
When expansion comes from usage and self-serve adoption, dividing that ARR by a shrinking Sales & Marketing line inflates the ratio for reasons that have nothing to do with your go-to-market team.
The team at Mostly Metrics calls it a "party trick" for exactly this reason: it is a fun single number that hides the four things that actually determine whether growth is worth funding.
Magic number vs CAC payback vs NRR: the efficiency stack
No serious board reads the Magic Number alone anymore. It is the smoke alarm. CAC payback and net revenue retention are the inspection. Here is how the three fit together with 2026 benchmarks.
| Metric | What it answers | Includes margin? | 2026 median |
|---|---|---|---|
| Magic Number | Is my S&M spend converting to growth? | No | 0.7–0.9 |
| CAC payback | How long to earn back acquisition cost? | Yes | 15–18 months |
| Net revenue retention | Does the base grow without new logos? | Effectively | ~104% (118% at p90) |
FE International's valuation data puts elite CAC payback under 12 months and premium NRR above 120%. A Magic Number of 0.8 with 85% margins and 115% NRR is a genuinely fundable business. The same 0.8 with 50% margins and 95% NRR is a company buying revenue it cannot keep.
Only increase Sales & Marketing spend when the Magic Number is above 0.8, CAC payback is under 18 months, and NRR is above 105%. Miss any one and you are scaling a leak. Pair this with your CAC payback math and your core sales KPIs.
Your agency's new-business channel has a magic number too
Here is the part the SaaS-finance crowd never says out loud: the Magic Number is not really about software. It is about whether a growth channel converts spend into recurring revenue. Every agency owner runs one whether they measure it or not.
Swap the words. Your "net-new ARR" is the annual value of new recurring client contracts you land. Your "Sales & Marketing spend" is what you burn to win them: ad budget, an SDR's salary, and on Upwork, Connects plus the hours your team spends writing and sending proposals. Divide one by the other and you have your channel's magic number.
The lever is the numerator. On Upwork, new recurring revenue is throttled by reply rate: send 40 proposals, get 2 replies, and it does not matter how cheap your Connects are. The channel is inefficient because the conversion is broken, not because the spend is high. It is the same idea as sales velocity for your pipeline. That is precisely where GigRadar moves the number.
Free for Upwork agencies
Fix the numerator, not just the spend
GigRadar operates a real Upwork Business Manager account that submits your proposals under our team's supervision, so your agency wins more new recurring revenue per hour of bidding. Your own account is never touched. We will audit your channel's magic number for free.
Get Your Free Agency Audit →A worked example, end to end
Numbers make it concrete. Take a marketing-analytics platform closing out Q2.
New logos $250K + expansion $100K − churn $50K = $300K net-new ARR in Q2.
Q1 Sales & Marketing was $400K. Always lag it one quarter: deals close after the spend.
$300K ÷ $400K = 0.75. Healthy. Net-new ARR is already annual, so it does not get multiplied.
85% margins and ~19-month CAC payback? The 0.75 is real. Lift NRR from 104% to 115% and payback drops under 18 months, and now you have permission to invest. Sanity-check the unit economics against your break-even point first.
The five-step magic number playbook
The board-ready version. Run this once a quarter and copy the summary straight into your update.
- Pick one formula and label it. ARR-net for internal decisions, GAAP for investor comparison. Never mix them across quarters.
- Lag Sales & Marketing by a quarter. Match the spend to the revenue it actually produced.
- Read the band, not the decimal. Below 0.75, fix the engine. Above it, you have earned the right to scale.
- Layer in margin, CAC payback and NRR. A high number on bad margins is a warning, not a green light.
- Find your worst channel and fix its numerator. The cheapest efficiency gain is a broken channel converting better, not a good one spending more.
Frequently asked questions
Anything from 0.75 to 1.0 is healthy and signals you can keep investing in growth. Private-SaaS medians sit around 0.7–0.9. Above 1.5 usually means you are under-investing.
Only in the GAAP-revenue version, because quarterly revenue is roughly a quarter of your annual run-rate. If your numerator is net-new ARR, it is already annual, so you do not multiply by four.
Net subtracts churn and contraction and is the honest number once you are past $1–2M ARR. Gross (new plus expansion only) is fine early on to gauge top-of-funnel conversion.
It ignores gross margin and churn, bundles all revenue into one figure, treats correlation as causation, and breaks for product-led growth. Read it alongside CAC payback and NRR.
Yes. Any recurring-revenue channel has one: new recurring client revenue divided by what you spent to win it. For Upwork agencies that spend is Connects plus bidding time, and the number is usually far lower than owners assume.