🎬 Sales Pipeline Stages walkthrough — the 7 stages, the conversion math for each, and the one fix that stops deals stalling, in under two minutes. Watch on YouTube
The Short Version
- A sales pipeline has 7 stages: prospecting, qualification, discovery, proposal, negotiation, closing, and post-sale. Each one needs an exit criterion the buyer has to trigger, not an activity you perform.
- Most pipelines leak in the middle: roughly 60–70% of opportunities end in "no decision," not in a competitor's hands.
- Realistic B2B math: about 15% of MQLs become SQLs, ~10–12% of those become opportunities, and 6–9% of opportunities close. Win rate falls from ~31% on sub-$10k deals to ~15% above $100k.
- A pipeline is not a funnel. The funnel is everyone who could buy; the pipeline is only the deals you're actively working. Never add the two together.
- Use the velocity calculator below to turn opportunity count, deal size, win rate, and cycle length into one revenue-per-day number.
Six or seven deals out of every ten in a typical B2B pipeline never become a yes or a no. They become a no decision.
The prospect goes quiet, the deal sits in "negotiation" for ninety days, and eventually someone drags it to closed-lost out of embarrassment. That number, documented across thousands of opportunities by Gong's analysis of stalled deals, is the single most useful fact about sales pipeline stages.
It tells you the enemy is not your competitor. The enemy is the deal that refuses to move and the stage definition that let it sit there.
So this guide does two things most "what are the stages of a sales pipeline" articles skip. It defines each stage by the buyer action that closes it, then gives you the conversion benchmarks for every stage so you can see exactly where your version leaks.
A pipeline is not a funnel, and treating them as one quietly wrecks your forecast
The funnel is a marketing object. It tracks the whole journey from a stranger seeing your name to a signed contract, and HubSpot's own framing is customer-centric: awareness, consideration, decision.
The pipeline is a seller object. It only contains opportunities that have crossed a threshold of fit and intent, each one carrying a forecast amount and a probability.
The funnel's input is everyone. The pipeline's input is qualified deals.
Why this matters operationally: the moment you sum "leads in the funnel" and "deals in the pipeline" into one number, your forecast double-counts and your coverage math breaks. Marketing fills the funnel, the funnel hands qualified deals to the pipeline, and the pipeline produces revenue (these are sequential, never parallel).
If your CRM reports "247 leads in the pipeline," you almost certainly have a funnel mislabeled as a pipeline. A real pipeline rarely holds hundreds of active opportunities per rep; it holds dozens.
For Upwork agencies the same split applies, just with different surfaces: the job feed and your proposals are the funnel, the clients who replied and booked a call are the pipeline. We mapped that agency-specific version in our funnel-for-Upwork-agencies breakdown and what a healthy Upwork pipeline looks like.
This guide is the broader B2B version that sits above both.
The one number that tells you if your pipeline is healthy
Before the stages, build the instrument. Sales velocity collapses your entire pipeline into a single figure: how much revenue it produces per day.
The formula, used by Gong and most RevOps teams, is opportunities times average deal size times win rate, divided by sales cycle length. Plug in your numbers, and the output tells you which lever (more deals, bigger deals, higher win rate, or a shorter cycle) moves revenue most for you.
Free Interactive Tool
Sales Pipeline Velocity Calculator
Enter four numbers. Get your revenue-per-day, revenue-per-month, and the pipeline coverage you need to hit a target.
Reverse it: how much pipeline do you need?
Enter a revenue target and we'll back into the opportunities and pipeline value you need at standard 3x coverage.
Track the same win-rate and response-rate inputs on real deals with proposal analytics that surface win rate and response rate.
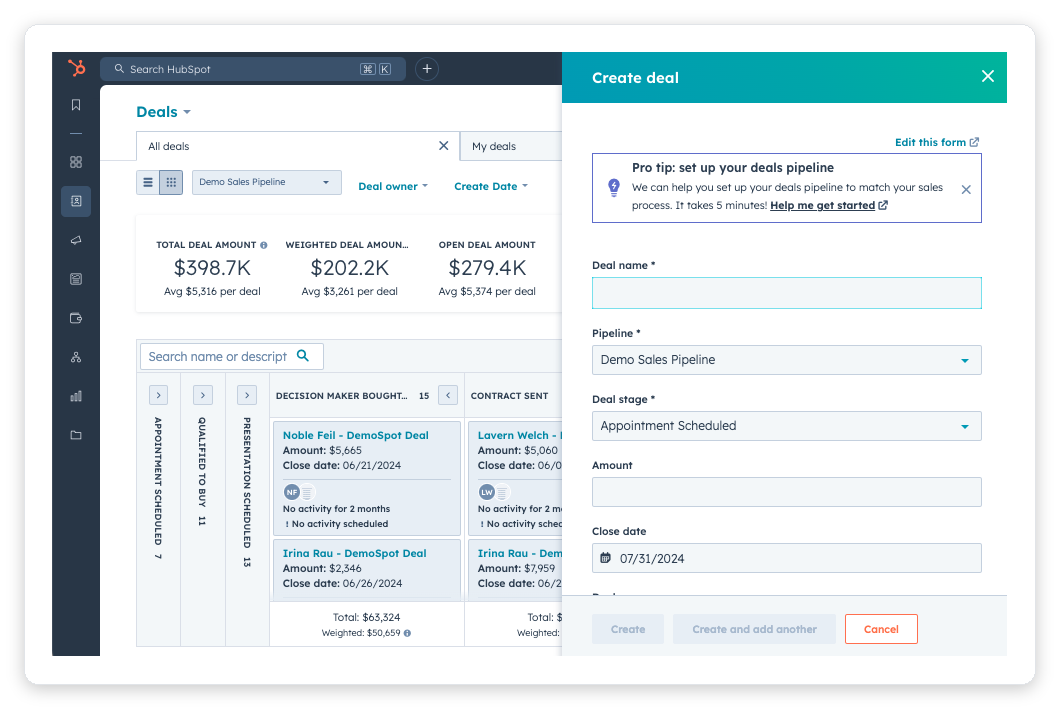
The 7 sales pipeline stages, defined by the exit criterion buyers actually trigger
Here is the canonical structure used inside Salesforce and HubSpot opportunity models. The label on each stage is common knowledge.
The exit criterion is the part teams forget, and it is the only thing that stops deals from rotting.
You identify accounts that match your ICP and make first contact. Exit criterion: the prospect actually replies, opens a chat, or books time (not "I sent the email").
You confirm fit and intent (budget, authority, need, timeline). Exit criterion: the prospect confirms a real problem and a willingness to evaluate, becoming a sales-qualified lead.
The first real working session, where an opportunity is formally created. Exit criterion: you've documented the buyer's success metric and they've agreed to see a tailored solution.
You present price and scope. Exit criterion: the buyer accepts in principle and moves to terms, where a tight scope of work stops negotiation from reopening everything.
Terms, legal, and internal approvals. Exit criterion: all stakeholders sign off and only the signature remains (if you can't name the economic buyer here, the deal isn't really in this stage).
Won, lost, or (the honest third option) no decision. Exit criterion: a signed contract or a documented reason for the loss you can learn from.
The stage most pipelines pretend ends at "won." Exit criterion: the customer is live, getting value, and renewing or expanding. This is where net revenue retention is won or lost.
Where deals actually die: the conversion math of each stage
Stage labels are free. The benchmarks below are what separate a pipeline that forecasts from one that hopes.
These are aggregated B2B conversion rates from MarketJoy and the Ebsta B2B benchmarks.
| Transition | Typical conversion | What it really measures |
|---|---|---|
| Lead → MQL | 20–25% | Fit + meaningful engagement |
| MQL → SQL | 12–18% | Sales accepts the lead is real |
| SQL → opportunity | 10–12% | Confirmed problem + evaluation |
| Opportunity → closed-won | 6–9% | The deal actually closes |
Read the table as a diagnosis tool. If your lead-to-MQL number is healthy but MQL-to-SQL is far below 12%, your top of funnel works and your qualification is broken.
The fix lives in stage 2, not in more leads.
Win rate and cycle length both bend with deal size
A single company-wide "win rate" hides more than it reveals. Win rate falls and sales cycle stretches as deals get bigger, because larger purchases pull in more stakeholders and more risk.
Numbers below come from Autobound's SaaS benchmark study and Focus Digital's cycle-length data.
| Deal size | Typical win rate | Typical cycle length |
|---|---|---|
| Under $1k | High | ~25 days |
| Under $10k | ~31% | 25–55 days |
| $10k–$50k | ~24% | 60–120 days |
| $50k–$100k | ~18% | 120–220 days |
| Above $250k | ~15% | 220–270 days |
The practical takeaway: a pipeline full of $80k deals and a pipeline full of $6k deals need completely different coverage ratios and follow-up cadences. Forecasting them with one blended win rate is how quarters get missed.
The no-decision problem is a qualification problem in disguise
Most stalled deals don't die at closing. They die at qualification and only get buried at closing.
A deal that entered the pipeline without a confirmed problem, budget, and decision-maker was never a real opportunity. It was a hope wearing an opportunity's clothes.
Gong's research on win rates and the Salesforce State of Sales both point to the same root cause: status-quo bias. The prospect's safest choice is to do nothing, and a weakly qualified deal gives them every excuse to take it.
Add one mandatory exit field to your qualification stage in the CRM: "Named decision-maker." If a rep can't fill it the deal can't advance past stage 2, and your no-decision rate falls within a quarter.
Agency pipelines and SaaS pipelines share the stages but not the shape
The seven stages are universal. How they're weighted is not.
SaaS pipelines are standardized and segmented by contract value, leaning on demos, trials, and recurring-revenue math. Agency pipelines are bespoke: the discovery stage carries far more weight because scope is custom on every deal.
| Stage | SaaS emphasis | Services / agency emphasis |
|---|---|---|
| Qualification | ICP fit, MQL/SQL scoring | Budget reality + scope fit |
| Discovery | Product demo, free trial | Deep needs analysis, custom strategy |
| Proposal | Standard pricing tiers | Custom SOW, project vs retainer |
| Post-sale | Onboarding, seat expansion, NRR | Delivery, upsell, retainer renewal |
If you run an agency, the highest-leverage stage is usually qualification, because a mis-scoped deal poisons delivery for months. We go deeper on the agency-specific motion in how agencies actually acquire clients.
Shorten the cycle by fixing the front of the pipeline, not the back
Every team obsesses over the closing stage. The cheapest velocity gains hide at the front: feed the pipeline better-fit opportunities and stages 3 through 6 get faster on their own, because well-qualified buyers move with less friction.
This is where the input quality compounds. In GigRadar's own pipeline data (133,872 outbound proposals across Upwork, Dec 2025–Feb 2026), reply rate per freelancer profile spanned 1% to 18%.
Same effort, same platform, an 18x spread driven almost entirely by fit and positioning rather than volume.
The lesson transfers to any pipeline: when the front is full of poorly-qualified opportunities, no amount of closing skill saves the quarter. When the front is full of well-matched ones, even an average closer wins.
That said, the closing stage still has technique. One of the instructors in GigRadar's Agency Success course walks through an assumptive-close-plus-premium-anchor move that recovers deals stuck in negotiation:
🎥 From GigRadar's Agency Success Course — Always Close the Deal.
For the negotiation stage specifically, our negotiation scripts for agencies cover budget, timeline, and scope pushback line by line. And if you're weighing manual versus automated closing motions, we compared the close rates directly.
Free for Upwork agencies
Fill the front of your pipeline with better-fit deals
GigRadar surfaces Upwork jobs that match your ICP and submits proposals through our managed Business Manager, so your pipeline starts with qualified opportunities instead of noise. Your agency account is never touched.
Get Your Free Agency Audit →Take it with you: the stage benchmark cheat sheet
Download the full stage-and-benchmark table as a CSV and paste it straight into your CRM stage settings or a forecasting sheet.
7 stages, exit criteria, and conversion benchmarks in one file.
Frequently asked questions about sales pipeline stages
Six to seven: fewer than five hides where deals stall, while more than eight creates admin overhead and subjective stage calls. The canonical set is prospecting, qualification, discovery, proposal, negotiation, closing, and post-sale.
The funnel is the full customer journey including anonymous prospects (a marketing view), while the pipeline is only the active, qualified opportunities a rep is working (a seller view). They're sequential stages, so never add the two counts together.
Healthy B2B benchmarks: ~20-25% lead to MQL, ~15% MQL to SQL, ~10-12% SQL to opportunity, and ~6-9% opportunity to closed-won. Compare each transition separately to find your specific leak.
Roughly 60-70% of pipeline stalls to no decision because of status-quo bias and weak qualification. Deals that enter without a confirmed problem, budget, and decision-maker give the buyer every reason to do nothing.
Multiply the number of opportunities by average deal size by win rate, then divide by sales cycle length in days. The result is revenue produced per day, and the calculator above runs it on your own numbers.
Sales pipeline stages aren't a reporting chore. They're the operating system that turns daily activity into a forecast you can trust.
Define each stage by what the buyer does to leave it, watch the conversion math between stages, and fix the front before you blame the close.