Win Rate Calculator
🎬 Win Rate Calculator walkthrough — why your win rate is probably a lie, the real 2026 benchmarks, and how to read the free calculator below. Watch on YouTube
TL;DR
- Win rate = deals won ÷ deals that reached a decision (won + lost). Put open deals in the denominator and the number becomes meaningless.
- "Good" is defined by your denominator: B2B opportunity win rate averages 20–21%, proposal-stage win rate ~47%, but an Upwork proposal-to-hire rate of 3–7% is structurally normal, not failure.
- Use the free calculator below to get your win rate, a benchmark tier, revenue per 100 proposals, and sales velocity in one shot.
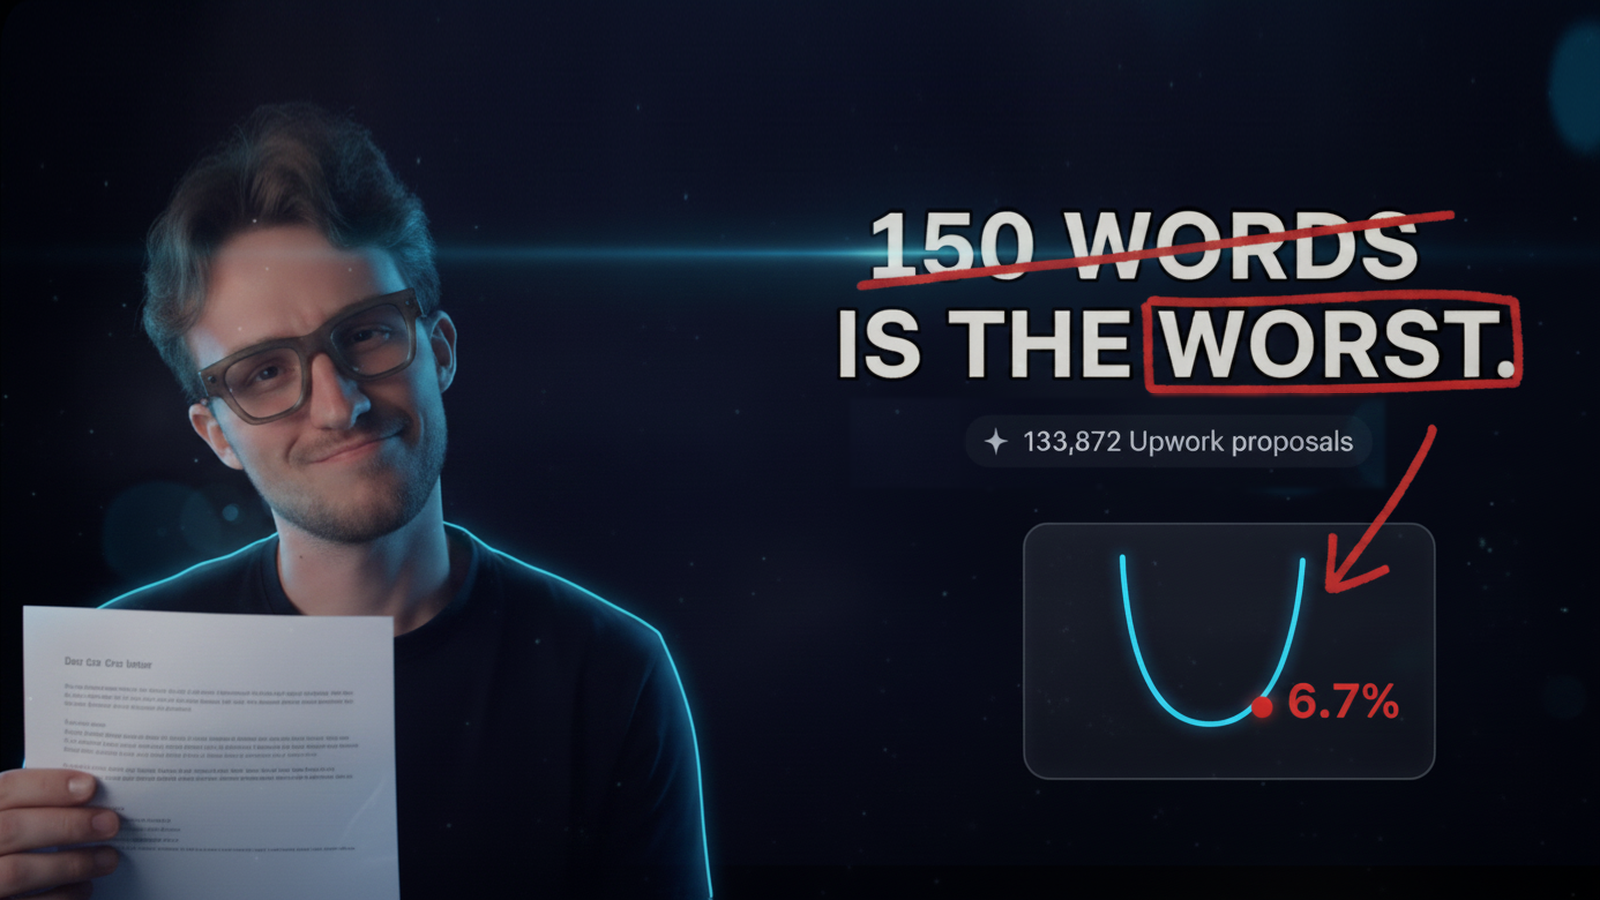
- GigRadar pipeline data (133,872 proposals): matching a client's budget is the worst bid you can make (8.8% reply) and "filter for whale clients" backfires (3.85% reply for $500k+ spenders vs 8.15% for $1k–5k).
- Win rate is a multiplier, not a scoreboard. Lifting it from 20% to 30% adds 50% more revenue on the same pipeline.
Most agencies quoting their "win rate" are quoting a number that can be moved 20 points in either direction without closing a single extra deal. The denominator is doing the lying, not the wins.
Across the sources that actually define this metric (HubSpot, RAIN Group, MetricHQ), win rate is one formula with one rule that almost everyone breaks.
Get the rule right and the number becomes the single most useful forecasting input you own. Get it wrong and you are grading yourself on noise.
Your win rate is probably a lie, and the fix is one denominator
The formula is trivial. The discipline is not.
RevOps reference Altior calls win rate "simple to calculate, constantly gamed" and names the exact attack: redefining what counts as a deal. Mark every silent loss "unqualified" after the fact and you can delete nearly every loss from the denominator.
MetricHQ is blunt about the most common error: dividing wins by every deal in the pipeline, including the ones still open. That produces a number that drifts every time a deal moves a stage and never reflects how often you actually close.
The second trap is confusing win rate with close rate. PandaDoc draws the line cleanly: win rate's denominator is decided deals only (won or lost), while close rate's denominator is every lead you touched.
A team with tight qualification can show a low close rate and a high win rate at the same time. Both numbers are correct, because they answer different questions.
| Metric | Denominator | Question it answers |
|---|---|---|
| Win rate | Won + lost (decided only) | When a decision is made, how often do we win? |
| Close rate | All leads / opportunities | What share of everything we touched converted? |
| Reply rate | Proposals sent | How often does a client respond at all? |
For an Upwork agency, reserve "win rate" for proposals that reached a real decision (a hire happened, on that job, to someone). Use reply rate as a separate funnel stage, never as a stand-in for winning.
Win rate calculator: your rate, revenue, and velocity in one shot
Free Interactive Tool
Win Rate & Revenue Calculator
Enter your real numbers and get your win rate, a benchmark tier, revenue per 100 opportunities, and sales velocity. Nothing leaves your browser.
Sales velocity follows the standard opportunities × deal size × win rate ÷ cycle length formula. The "+3 points" line shows the revenue you would add by lifting win rate three percentage points on the same volume.
What counts as "good" depends entirely on the denominator
There is no universal good win rate, and anyone quoting one without a denominator is selling something.
At the opportunity level, 2025 B2B benchmarks from Ebsta and Pavilion put the average win rate at 20–21%, with top teams clearing 30%. At the proposal stage the picture changes: RAIN Group reports a 47% average on proposed deals, and 72% for elite performers, because a proposal is already a filtered, mature opportunity.
| Context (definition) | Average | Top performer |
|---|---|---|
| B2B opportunity win rate | 20–21% | 30%+ |
| B2B SaaS (by opportunity) | 20–30% | 35%+ |
| Cross-industry proposal stage | ~47% | 60–72% |
| Consulting / services (proposal) | 30–50% | 60%+ |
| Formal RFP win rate | 43–45% | 60%+ |
| Upwork proposal-to-hire | 3–7% | 10–15% |
Sources: Gradient Works, RAIN Group, SystemX, Bidara RFP 2026, GigRadar pipeline data.
The RFP and consulting numbers look enviable until you remember they assume selective bidding. Bidara's 2026 data shows the average RFP win rate at 45% precisely because mature teams disqualify hard before they ever write a word.
Bid on everything and your win rate falls to match. The denominator you choose is a strategy decision, not a reporting detail.
On Upwork, a 5% win rate is the ceiling, not the failure
Drop the B2B benchmarks into a marketplace and they invert. Upwork agencies bid at volume into a pool where most jobs are never awarded to anyone, which is the same "no decision" bucket that Outreach flags as the silent killer of B2B win rates.
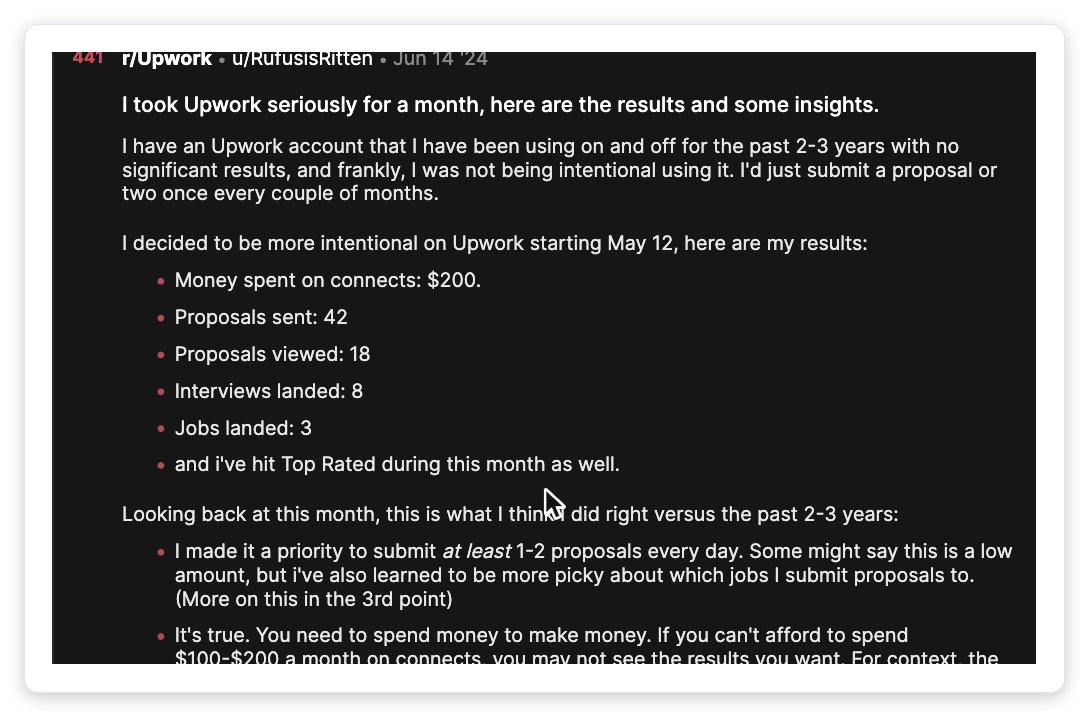
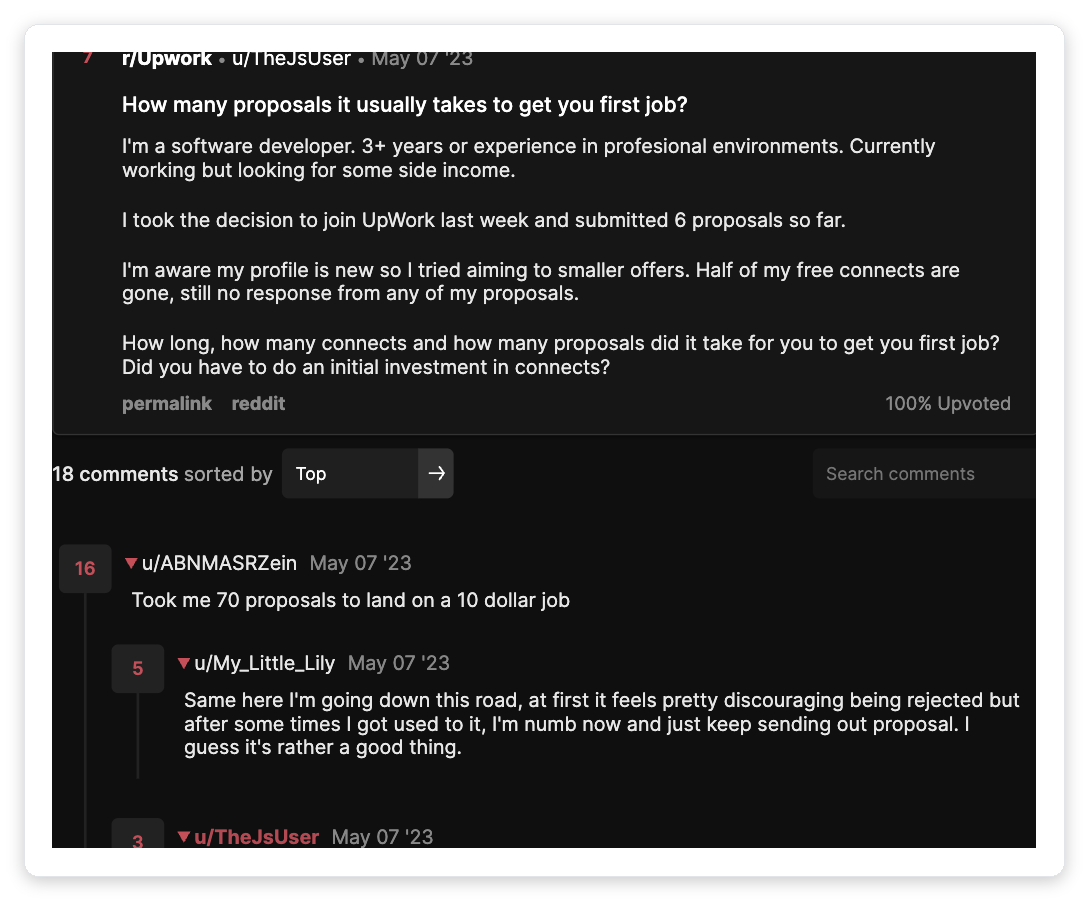
Three hires from 42 proposals reads like a problem until you see the rest of the threads. The variance is brutal at the low end.
First-party data sets the real baseline. GigRadar's analysis of 133,872 outbound agency proposals (Dec 2025–Feb 2026) found a platform-mean reply rate of 7.45%, with top-quartile teams at 12.86% and bottom-quartile at 3.76%.
Reply rate is the gate before win rate. A proposal-to-hire rate in the low single digits is the structural norm, not a sign you are bad at this.
The three mistakes that wreck your win rate math
Most broken win rates trace back to the same three errors. Fix them in order.
Including still-open jobs makes the number swing every week. Only count proposals where the job was decided: a hire happened or the post was closed without one.
Tagging every silent client "not a real lead" after they ghost you is how a 4% win rate becomes a 20% one on paper. Set your bid criteria before you bid, then count every qualifying loss.
Reverse-engineering "what works" from won proposals alone is textbook survivorship bias. The patterns that actually predict a win only show up when you compare wins against losses.
Reply-getters and hire-getters are not the same proposals: in GigRadar's data, a question-based opener can lift reply rate while doing nothing for hires. Track reply rate and win rate as two separate numbers, or you will optimize the wrong one.
Why "match the budget" and "chase whales" tank your real win rate
Two pieces of standard Upwork advice are actively lowering your win rate, and the pipeline data is not subtle about it.
The first is bidding at the client's posted budget. In GigRadar's proposal data, bidding under 50% of the posted budget drew a 20.6% reply rate, while matching it (95–105%) drew just 8.8%.
Anchoring low signals confidence and reads as a deal. Landing exactly on the number reads as a generic auto-bid.
Reply rate by bid vs posted budget
GigRadar pipeline data, 59,339 proposals joined to bid-amount records.
The second is the "only pitch high-spend clients" rule. Whale clients with $500k+ in lifetime spend replied at just 3.85%, while clients in the $1,000–5,000 band replied at 8.15%.
The whales are buried in proposals and usually have an agency on retainer already. The mid-spend clients are the ones who actually answer.
Category choice swamps both. Reply rates by category range from 14.58% in Game Design and 14.38% in Lead Generation down to the 5.6–7.2% band for saturated Web, Mobile, and AI/ML work.
Picking the right category is a bigger win-rate lever than any single proposal edit.
Free for Upwork agencies
Raise the number before the proposal, not after
GigRadar surfaces the high-reply jobs (right category, right spend band, right budget gap) and submits your proposals through a real, human-supervised Upwork Business Manager account, so your own account is never touched. Tracked as a channel, Upwork becomes the cheapest acquisition you have.
Get Your Free Agency Audit →Win rate is a multiplier, not a scoreboard
The reason to fix your win rate is not the grade. It is the leverage.
Revenue from a batch of opportunities is roughly opportunities × average deal size × win rate. Add the time dimension and you get sales velocity: the same product divided by cycle length, which tells you how fast revenue moves through the pipeline.
That is the whole argument for treating win rate as a lever. Lifting it ten points on a fixed pipeline beats grinding out twice the proposals, and it costs no extra Connects.
For most agencies the cheapest point of win rate comes from picking better jobs, not writing better prose.
Run your own numbers back through the calculator above. If the "+3 points" line is bigger than what you would earn from doubling volume, your next quarter is a targeting problem, not an effort one.
That makes the case for treating Upwork as a measured acquisition channel rather than a lottery, the same way you would track any outbound motion.
Frequently asked questions
What is the formula for win rate?
Win rate = deals won ÷ (deals won + deals lost) × 100. Only deals that reached a final decision belong in the denominator, so open deals never count.
What is a good win rate?
It depends on the denominator. B2B opportunity win rate averages 20–21%, proposal-stage win rate sits near 47%, and a healthy Upwork proposal-to-hire rate is 3–7%, with top teams reaching 10–15%.
Is win rate the same as close rate?
No. Win rate counts only decided deals (won or lost), while close rate counts every lead you touched, including open ones, so a team can post a low close rate and a high win rate at once.
How do I handle "no decision" deals?
Pick one rule and keep it. The conservative standard counts no-decisions as losses, then tracks a separate "no-decision rate" so you can tell a competitiveness problem from a qualification problem.
Why is my Upwork win rate so low compared to B2B benchmarks?
Because most posted jobs are never awarded to anyone, which is a giant "no decision" pool. A 5–7% proposal-to-hire rate on Upwork is structurally normal and not comparable to a 45% selective-RFP win rate.