
Marketing Budget Calculator for Agencies
🎥 Watch: why the 7.8% benchmark is not a media budget, and how to size yours from the clients you actually need.
TL;DR
- The 7.8% of revenue benchmark everyone quotes is a fully loaded department cost. Only 31.4% of it is paid media, so a marketing budget calculator that multiplies your revenue by 8% and hands you a channel pie overstates your acquisition money by roughly 3.3x.
- Gartner's sample is 401 marketing leaders at companies mostly above $1B in revenue. You are not running that company, and the percentage is a function of scale rather than strategy.
- Budget bottom-up instead: clients you need, divided by your close rate, times what one qualified conversation costs. Then check the answer against revenue, not the other way around.
- A Google Ads lead in Business Services costs $93.69. A replied Upwork conversation costs $14.30 to $34.21 in Connects by category, and $8.28 to $53.04 at subcategory level, and the Upwork buyer has already posted a scope and a budget.
- Every channel has an absorption ceiling. Across 59,339 proposals with boost data, bids boosted into the 21 to 30 Connect band replied below the no-boost baseline, so the extra spend bought fewer conversations.
The number at the center of almost every marketing budget calculator on the internet is 7.8% of revenue, and almost nobody using it knows what is inside that number.
Gartner's 2026 CMO Spend Survey splits that budget into buckets: paid media 31.4%, labor 24.5%, martech 19.4%, and the remainder to outside agencies. Only the first bucket buys attention from a stranger.
Gartner's 2025 release states the media slice separately at about 2.4% of company revenue. So the honest media benchmark is not 8%.
It is closer to 2.4%, and the other 5.4 points are salaries, software and retainers you either already pay or do not have.
Every calculator that takes revenue, multiplies by 8%, and then splits the result across the "40% digital, 30% content, 20% events" grid that budget templates ship with is committing a category error at step one. The calculator below does it the other way round.
The gap between the benchmark and reality is why threads like this one exist. A marketer with 20 years of experience, running his own agency, asking strangers what they spend.
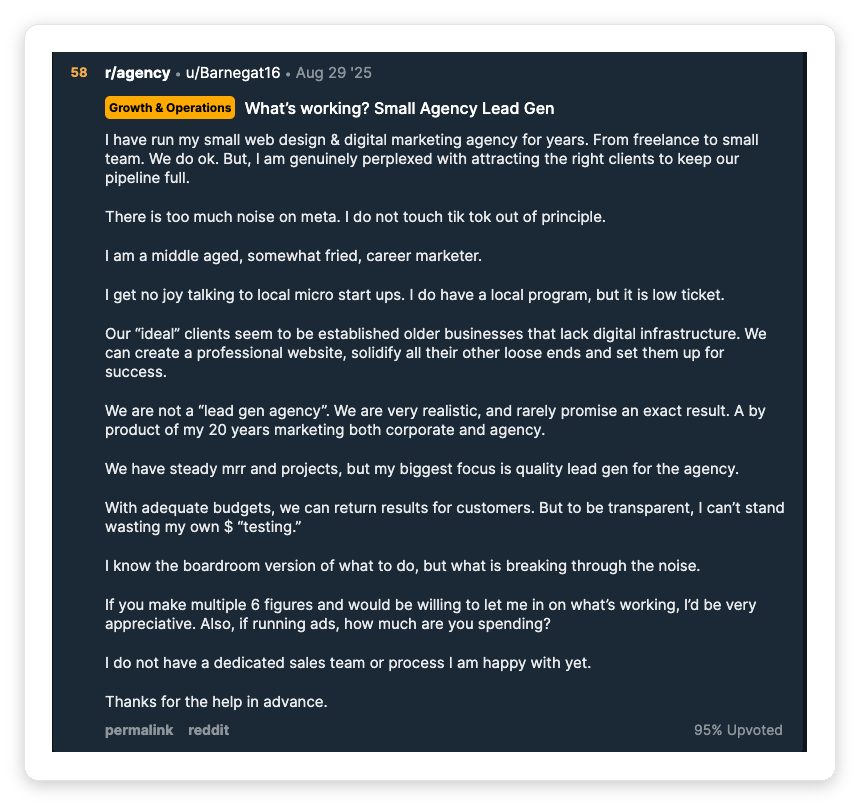
Source: r/agency. "I can't stand wasting my own money testing" is the real reason nobody trusts the percentage rule.
Marketing budget calculator: run your own numbers
Enter your own numbers. The tool derives the budget from the clients you actually need, then shows you the top-down benchmark next to it so you can see the gap.
Free Interactive Tool
Marketing Budget Calculator
Built for service agencies between $200k and $5M in revenue.
Step 1: the work the target implies
Step 2: your bottom-up budget
Step 3: what the benchmark would have said
Enter your numbers to see the verdict.
The fastest lever is usually the hours, not the channel. On the defaults, dropping business development from 12 hours a week to 8 pulls the total to about $99,400 and puts cost per client back inside the ceiling.
Nothing is stored or sent anywhere. The math runs in your browser.
The 8% benchmark is 69% not-media
The reason the benchmark feels wrong when you apply it is that it was never a media number. It is the cost of running a marketing department, and most agencies under $5M do not have one.
Composition of the average marketing budget. Source: Gartner 2026 CMO Spend Survey, 401 marketing leaders.
Notice what the outside-agencies line means for you. If you are the outside agency, a chunk of the benchmark is your own revenue, not your cost.
The second problem is the sample. Gartner surveyed 401 marketing leaders in North America and Europe, and most of them work at companies above $1B in revenue.
The CMO Survey run by Duke's Fuqua School with Deloitte and the AMA uses a broader US sample and lands higher, at 9.0% of revenue overall. Its B2B services cut, the closest thing to an agency, sits at 10.1%.
| Benchmark | % of revenue | Who was measured |
|---|---|---|
| Gartner 2026, all respondents | 7.8% | 401 leaders, mostly above $1B revenue |
| Gartner 2025, media only | about 2.4% | published separately in the 2025 release, not derived |
| CMO Survey Jan 2026, all firms | 9.0% | 308 US for-profit firms, loaded cost |
| CMO Survey Jan 2026, B2B services | 10.1% | the closest cut to an agency, loaded cost |
| CMO Survey Jan 2026, B2B product | 7.0% | for contrast, same survey |
Two surveys, two answers, 2.3 points apart. Any calculator that presents a single percentage as the correct one is hiding a methodology argument from you.
Revenue is a lagging output, so it makes a terrible input
The revenue you booked this quarter is the result of pipeline you built two to four quarters ago. Indexing spend to it means you cut the input at exactly the moment the output is already falling.
That is a control loop with the sign flipped. A soft quarter triggers a budget cut, the cut starves the pipeline, and the next quarter is worse by construction.
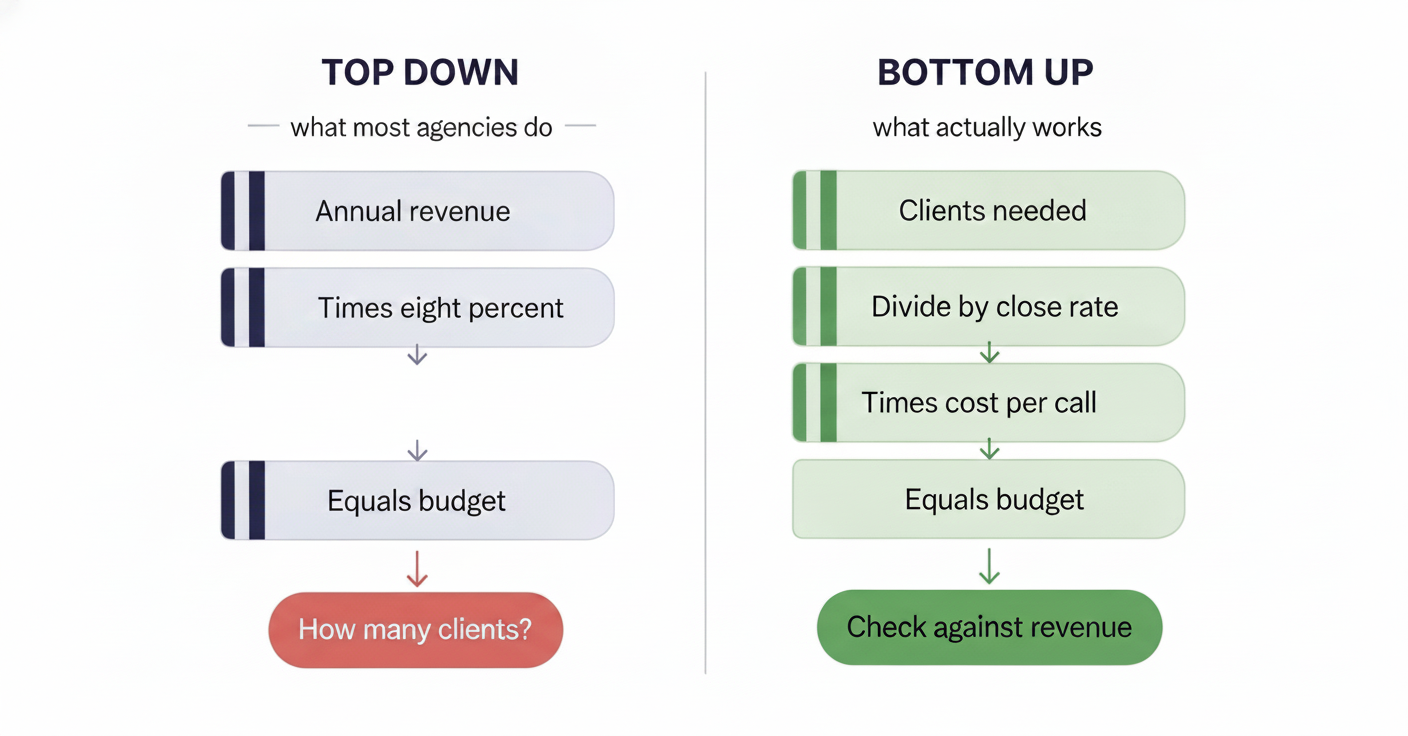
The bottom-up chain has four terms the percentage rule does not: churn, close rate, cost per conversation, and delivery capacity. Those are the four things that actually decide whether a dollar becomes a client.
Start from the target instead. If you need $750,000 of new revenue and a client is worth $60,000 in year one, you need 13 clients, and at an 8% conversation-to-close rate that is 157 real conversations with buyers.
What one of those conversations costs is not the same on every channel, and that is the only variable left.
What one qualified conversation costs on each channel
WordStream's 2026 benchmark study analyzed 13,474 US search campaigns between April 2025 and March 2026, and publishes the full per-industry table alongside it. Business Services came in at $5.87 per click, a 4.85% conversion rate, and $93.69 per lead.
Those three figures are averaged independently across campaigns, so they do not chain: dividing $5.87 by 4.85% gives $121, not $93.69. Use the reported cost per lead, never the derived one.
Agency owners comparing notes land in the same place without anyone showing them a benchmark table.
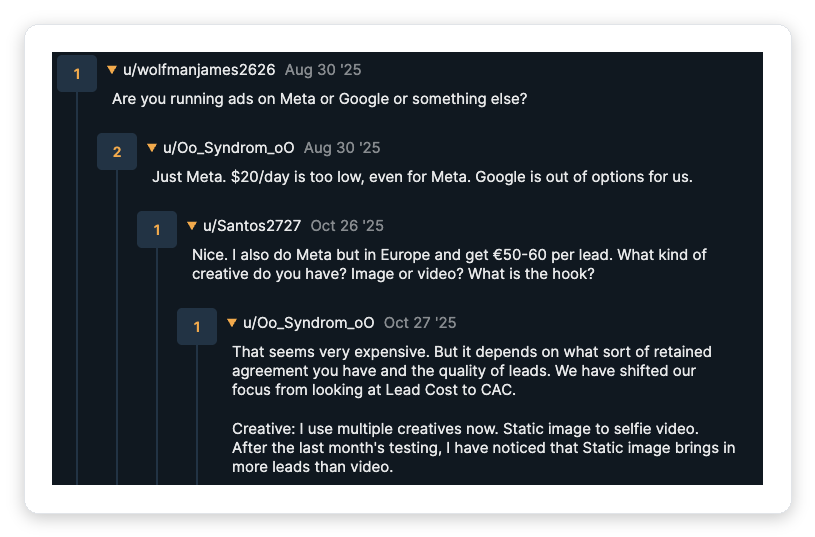
Source: r/agency. Note the last line: the shift from lead cost to CAC is the same move this article is arguing for.
On the other side, a proposal on Upwork costs Connects, and Upwork prices a Connect at $0.15. We analyzed 133,872 outbound proposals from GigRadar's pipeline between December 2025 and February 2026 and worked out the Connect spend behind every reply.
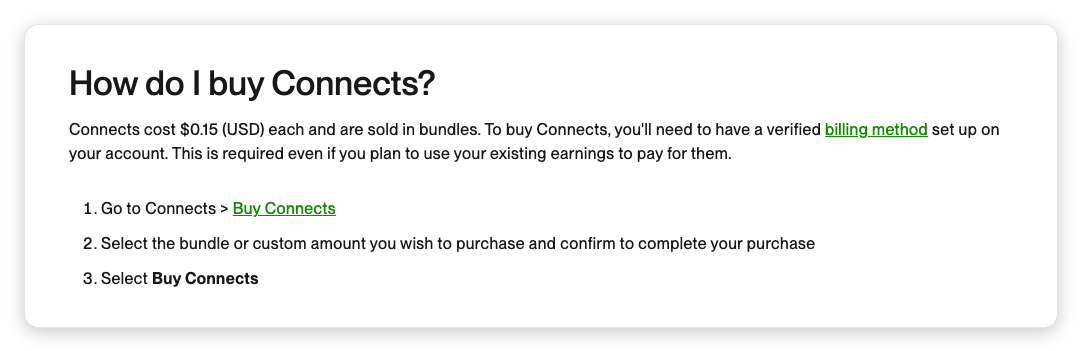
The price is fixed and public, which is what makes the unit cost auditable. Source: Upwork Help Center.
The most expensive Upwork category still costs a third of a Google Ads lead in Business Services. Even the worst subcategory in the sample, QA Testing at $53.04, comes in 43% cheaper.
Cost per qualified conversation, by Upwork category
Upwork: Connect spend per replied proposal, n = 133,872. Google Ads: reported cost per lead, n = 13,474 campaigns.
| Upwork subcategory | Connect spend per reply | vs a $93.69 Google lead |
|---|---|---|
| Other, Accounting & Consulting | $8.28 | 11x cheaper |
| Video & Animation | $9.55 | 9.8x cheaper |
| Marketing, PR & Brand Strategy | $12.82 | 7.3x cheaper |
| Web Development | $36.64 | 2.6x cheaper |
| QA Testing, the worst in the sample | $53.04 | still 43% cheaper |
Source: GigRadar pipeline data, 133,872 outbound proposals, December 2025 to February 2026, priced at $0.15 per Connect.
The two units are not identical, and the difference favors Upwork twice. A Google Ads lead is a form fill from someone who clicked an ad.
An Upwork reply is a buyer who wrote a scope, attached a budget, and answered you.
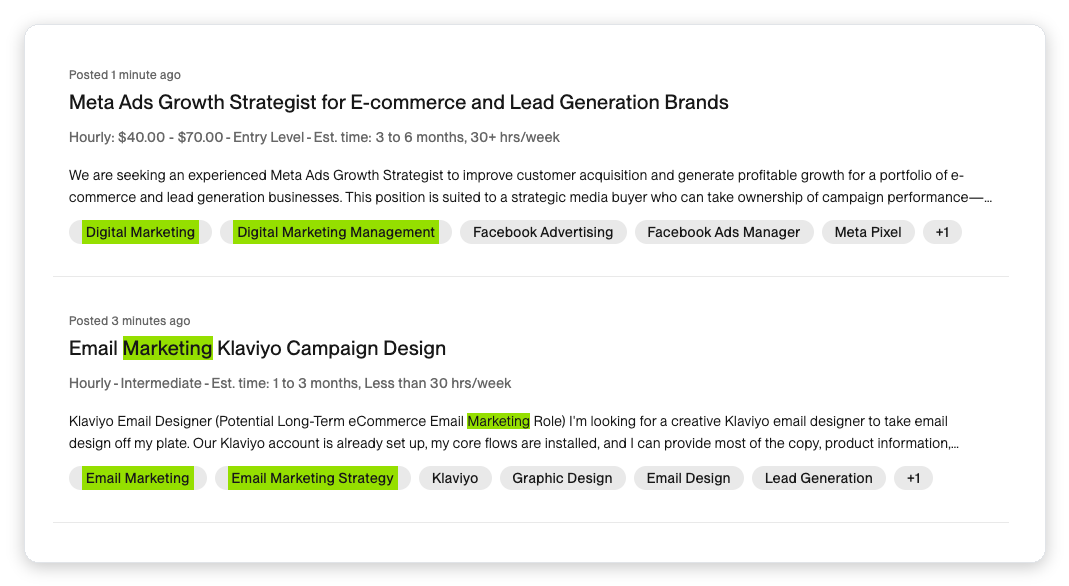
Two marketing briefs posted one and three minutes apart, both with a rate already attached. On the ads side you pay to manufacture that intent.
If you want the full per-channel breakdown including cold email and LinkedIn, we ran that comparison separately in cost per lead by channel.
You are already spending 9%, you just pay it in founder hours
Both benchmark surveys count marketing labor. That is why an agency owner who says "we barely spend anything on marketing" is usually comparing their ad spend against a fully loaded number.
Price the founder's time and the picture inverts. Twelve hours a week on business development across 48 working weeks, at a conservative $150 an hour of opportunity cost, is $86,400 a year.
Twelve hours a week, 48 weeks, at $150. On a $1.5M agency that is 5.8% of revenue from one person's calendar.
CRM, sequencer, enrichment, scheduling and site, at a modest $2,000 a month. Another 1.6% of revenue.
Add it and you clear 9% of revenue before a single dollar of paid acquisition.
The level was never the problem. The composition is, because 62% of that total sits in the one input that cannot be bought, scaled, or handed to anyone else.
This is the argument for treating acquisition tooling as a budget line rather than an afterthought. When there is no marketing department, the software and the channel spend are the department.
For Upwork agencies
Turn the cheapest line in your budget into your biggest one
We operate a real Upwork Business Manager account that your agency invites through Upwork's official invitation system. Proposals submit from our BM under our team's supervision, and your own account is never touched.
Get Your Free Agency Audit →Every channel has a ceiling, and yours is lower than the calculator thinks
A budget calculator assumes output scales with input. Our proposal data says it stops, and then it reverses.
In the 59,339 proposals with boost data, bids boosted into the 16 to 20 Connect band replied at 8.4%. Bids boosted into the 21 to 30 band replied at 6.5%, which is below the 6.8% baseline for bids with no boost at all.
Those rates sit higher than the per-category cost figures above because they run on the boost subset rather than the full proposal set. Compare bands within one chart, never across the two.
Roughly 40% more spend per bid bought fewer replies, not more. That is what a channel's efficient frontier looks like from the inside.
Crowding pushes the price up from the other side. Across the 30,964 distinct Upwork jobs in that same boost-joined subset, a proposal that was the only one from our pipeline on that job replied more than four times better than one landing on a job our pipeline had already piled onto.
Then delivery capacity caps it again. In the agencies we work with, a ten-person team onboards three or four clients a quarter before delivery starts slipping, and no amount of budget moves that inside the same quarter.
Stack the three and the honest answer for many agencies is to spend less on the primary channel and open a second one at its cheap end. Pushing a single channel past its frontier is how a budget produces a smaller result than the one before it.
Where the conventional allocation goes wrong
Once the total is right, the split still has to survive contact with an agency's actual size. Three of the four conventional lines do not.
| Conventional line | What it means on $80k | Verdict |
|---|---|---|
| 40% digital | $32,000 into a category, not a channel | Not a real line. Unit costs inside it differ by more than 10x. |
| 30% content | $24,000, roughly 20 to 30 articles | Right in principle, wrong horizon. Budget it as a 12 to 18 month asset on its own line. |
| 20% events | $16,000, about one regional booth | The worst line at this size. Attend, rarely exhibit. |
| 10% tools | $8,000 against a 19.4% enterprise norm | Backwards. With no marketing department, the software is the department. |
A better default for an agency under $5M is three lines, not four. Origination at 60%, tooling at 25%, and content as a separate 15% capital line you judge on an 18-month clock.
Origination is anything that produces a conversation this quarter: Connects, ads, outbound sending costs, a bidder.
Retainer economics change the weighting. If your average client stays two years, you can push origination higher, and we worked through that trade in retainer pricing.
Rebuild the budget in 90 days
The sequence matters, because two of the five steps produce the inputs the other three need.
Founder BD hours at your billable rate, every tool, every contractor. This is your real current percentage, and it is higher than you think.
Total channel cost divided by conversations that reached a real discussion. Not impressions, not clicks, not MQLs.
Use the calculator above with your own close rate. Compare it against the loaded benchmark and note which one is bigger.
Shift spend toward the lowest cost per conversation, then set a ceiling on that channel before efficiency starts falling.
Cost per client under a third of first-year gross profit, client count inside delivery capacity, per-channel spend under its ceiling. Anything that fails a gate does not get funded.
Take the budget lines with you
Paste this into your own sheet. It is the sheet version of the calculator, written so a finance person can audit it.
The percentage still has a job, just not the one it is usually given. Run your bottom-up number first, then divide it by revenue and see where you land.
If the total lands near the benchmark but your channel line is under 2% of it, the benchmark was never your problem. Your cheapest lever is the unit cost of a conversation, which is the entire reason we point agencies at Upwork as a lead generation channel in the first place.
Two numbers make the rest of this decidable: what a client is worth, covered in the customer lifetime value calculator, and what one costs today, covered in the CAC calculator. If Upwork is already your channel, the Connects cost-per-hire calculator converts Connect spend straight into cost per signed client, and Upwork's fee structure tells you what survives to margin.
The number most agencies get wrong is not the total, it is the split inside it. Channel spend usually turns out to be a rounding error next to the hours, which is the finding a percentage rule can never surface.
Want the version of this argument aimed at where the clients come from rather than what they cost? Start with getting clients for a marketing agency.